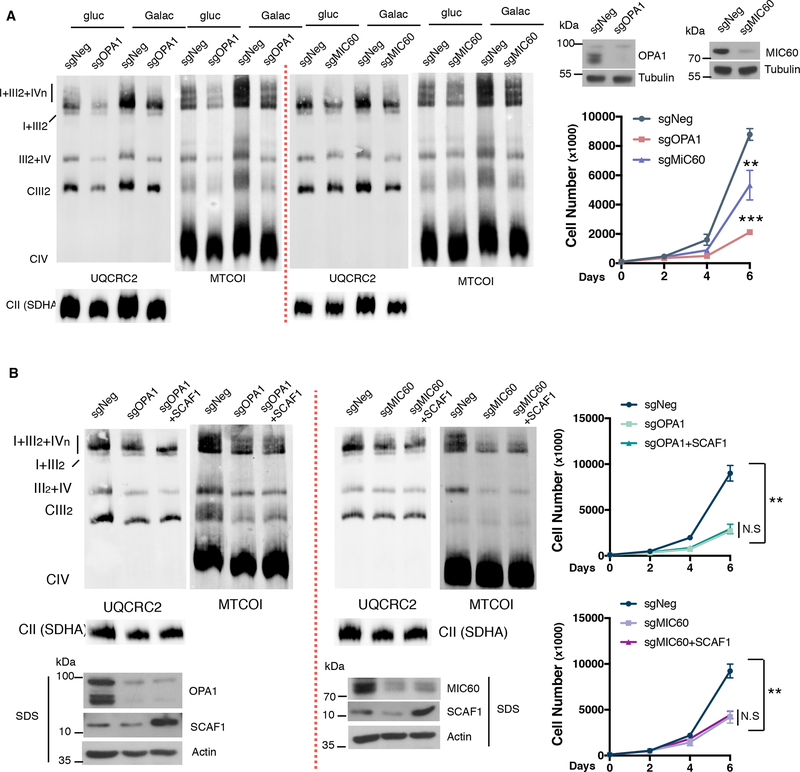
Figure 5: Nutrient and ER stress induced Supercomplex formation rely on mitochondrial cristae integrity.
(A) OPA1 or MIC60 depleted cells were assessed for SC levels by BNGE (left) and cell proliferation under galactose conditions (right). (B) SCAF1 protein was overexpressed in OPA1 and MIC60 depleted cells. SC levels (left) and cell proliferation (right) was analyzed under galactose conditions. Immunoblots shown are representative of >3 independent experiments using CII (anti-SDHA) as a loading control. All other experiments are the mean ± s.e.m., n>3. Asterisks denote *p<0.05, **p<0.01 or ***p<0.001. For two comparisons a two-tailed t-test was used.

