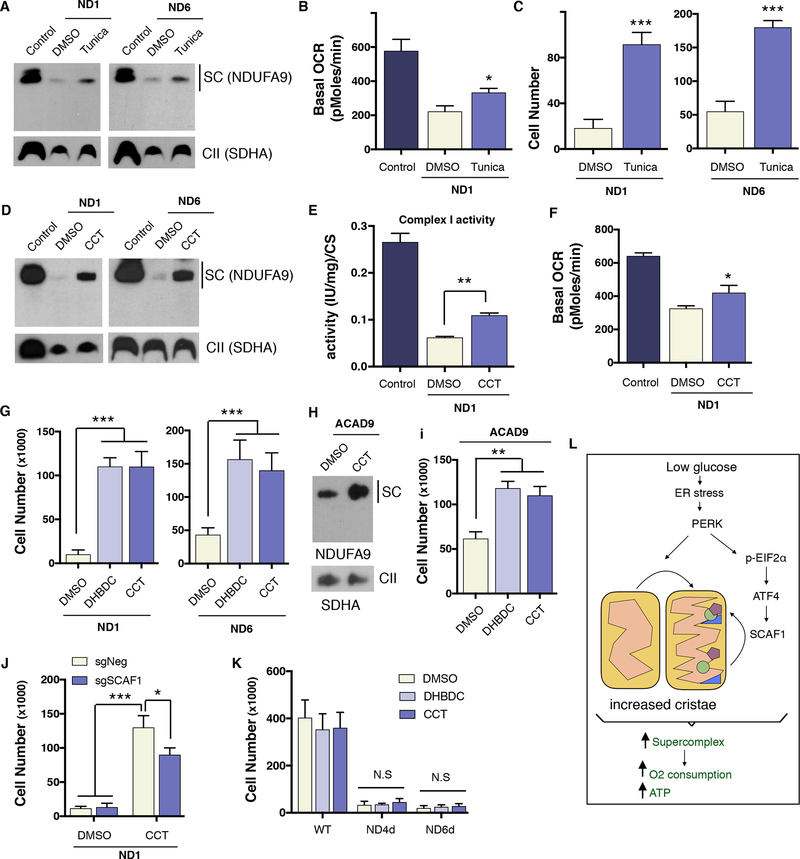
Figure 6: PERK activation ameliorates the bioenergetic deficiencies cause by human Complex I mutations.
(A) SC levels assessed by BNGE of ND1 and ND6 mutant cybrid cells treated for 72h with tunicamycin. (B) Oxygen consumption measurements in control cybrids and ND1 tunicamycin treated cells. (C) cell survival of ND1 and ND6 cells pretreated for 72h with DMSO or tunicamycinin in glucose then cultured in galactose media an additional 72 hours. (D) SC levels of ND1 and ND6 mutant cybrid cells treated for 72h with CCT020312. (E) Complex I activity and (F) Oxygen consumption levels in control and ND1 cybrids treated with DMSO or CCT020312. (G) Cell survival of ND1 and ND6 cells treated with DHBDC or CCT020312 in galactose for 72h. (H) SC levels and (I) cell survival of patient-derived fibroblast harboring a mutation in ACAD9 treated with DMSO or PERK activators. (J) ND1 SCAF1-negative and SCAF1-positive cell survival in galactose with DMSO or CCT020312 treatment after 72h. (K) Cell survival in galactose of WT, ND4d, or ND6d mouse fibroblast treated with DMSO or CCT020312 for 72h (L) Model depicting how glucose deprivation leads to an increase in mitochondrial ATP generation. During glucose-deprivation, PERK is activated stimulating increases in mitochondrial cristae density. In parallel, the PERK/eIF2α/ATF4 axis transcriptionally increases SCAF1 levels to assist in the formation of CIII and CIV containing supercomplexes. Overall, these molecular changes are aimed to stimulate the OXPHOS system and increase ATP production. Immunoblots shown are representative of >3 independent experiments using CII (anti-SDHA) as a loading control. All other experiments are represented as mean ± s.e.m., n>3. Asterisks denote *p<0.05, **p<0.01 or ***p<0.001. For two comparisons a two-tailed t-test was used, for multiple comparisons, one-way ANOVA with Bonferroni post-test was applied. Tunica, tunicamycin. CCT, CCT020312.

