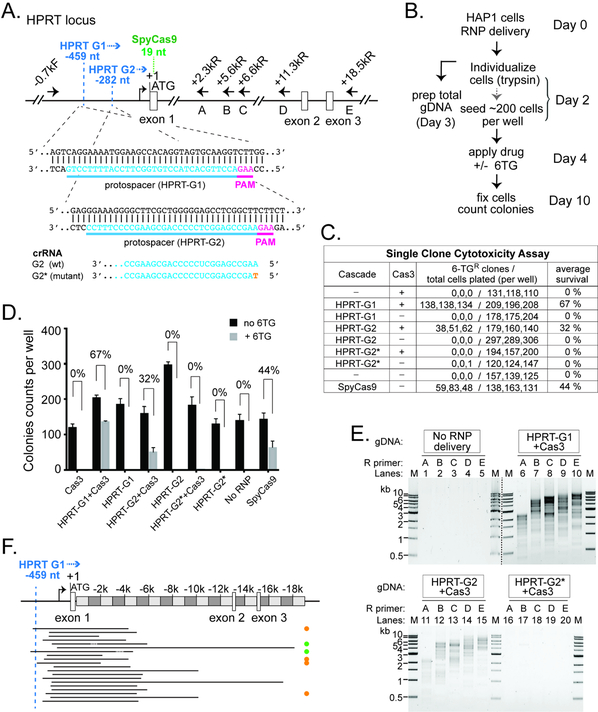
Figure 6. Efficient Editing at the Endogenous HPRT1 Locus in HAP1 Cells.
(A) Schematic of the HPRT locus and annealing sites for six PCR primers used in (E). Protospacers for the two crRNAs are indicated in blue, and corresponding PAMs in magenta. Positions relative to HPRT translation start site (+1) are indicated. Recognition sites (2nd nt of the PAM) for HPRT G1 and G2 are marked by the dashed blue line. Blue arrowhead, direction of Cas3 translocation. Recognition site (1st G in PAM) for the SpyCas9 is marked by the dashed green line. The G2 guide sequence is shown at the bottom, with the single nt mutation in HPRTG2* in orange. (B) Procedure of the genome editing experiments in HAP1 cells. (C) Estimate HPRT targeting efficiency by single clone 6-TG cytotoxicity assay. (D) Bar graph plotting the HAP1 colony counts obtained in (C). The average 6-TG survival rates from three independent experiments are indicated. Error bar, standard deviation. (E) A collection of DNA lesions was induced in the HAP1 cells treated with Cas3 and Cascades HPRT-G1 or HPRT-G2, but not the HPRT-G2* mutant. PCR primers used are indicated and their annealing sites depicted in (A). M, DNA size markers. Lanes from two different agarose gels are separated by the dashed black line. (F) Locations of the HPRT genomic deletions. Black lines, deleted genomic regions. Orange, green, and the lack of dots on the right indicate Groups II, IV, and I deletion junctions as described in Fig. 4B.

