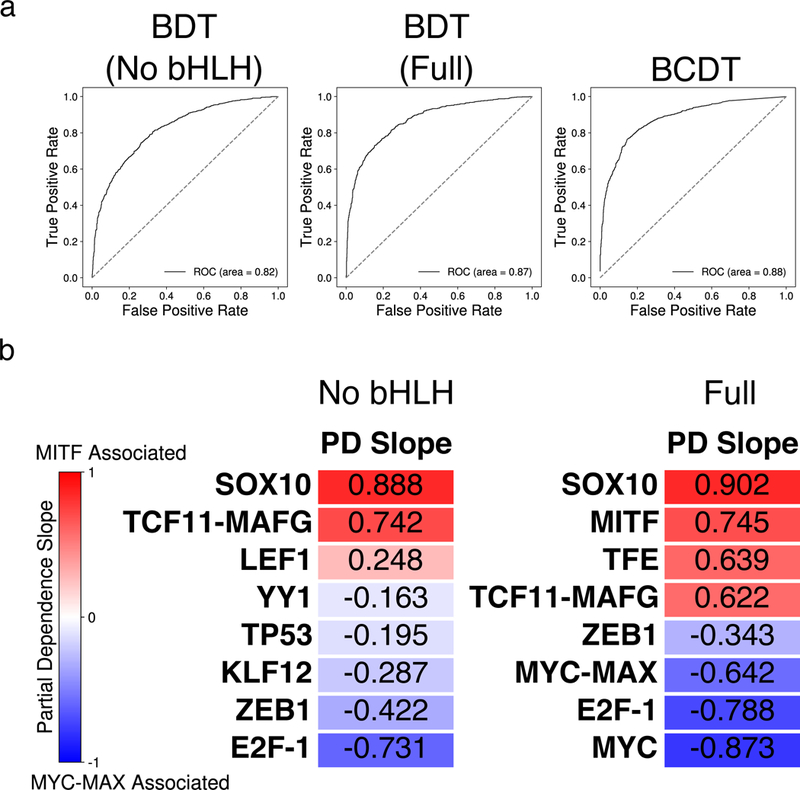
Figure 4:

(a) Area under the receiver-operating characteristic (ROC) curve for three different models trained to classify between MITF- and MYC-MAX-bound sequences. From left to right: BDT model with bHLH motifs removed; BDT model with full set of motifs; BCDT model. (b) Heatmap of the partial dependence slopes, ordered by slope, of the eight features with greatest importance for the BDT models with bHLH motifs removed (left) and using the full set of motif features (right). Positive (negative) slope values indicate a positive (negative) association between the presence of a particular motif and the model’s prediction that a sequence is bound by MITF (MYC-MAX). The relevant TRANSFAC IDs are as follows: (LEF1:M00805), (YY1:M00793), (TP53:M00761), (KLF12:M00468), (E2F-1:M00428), (TFE:M01029), (SREBP-1:M00220), (MYC: M00799).
