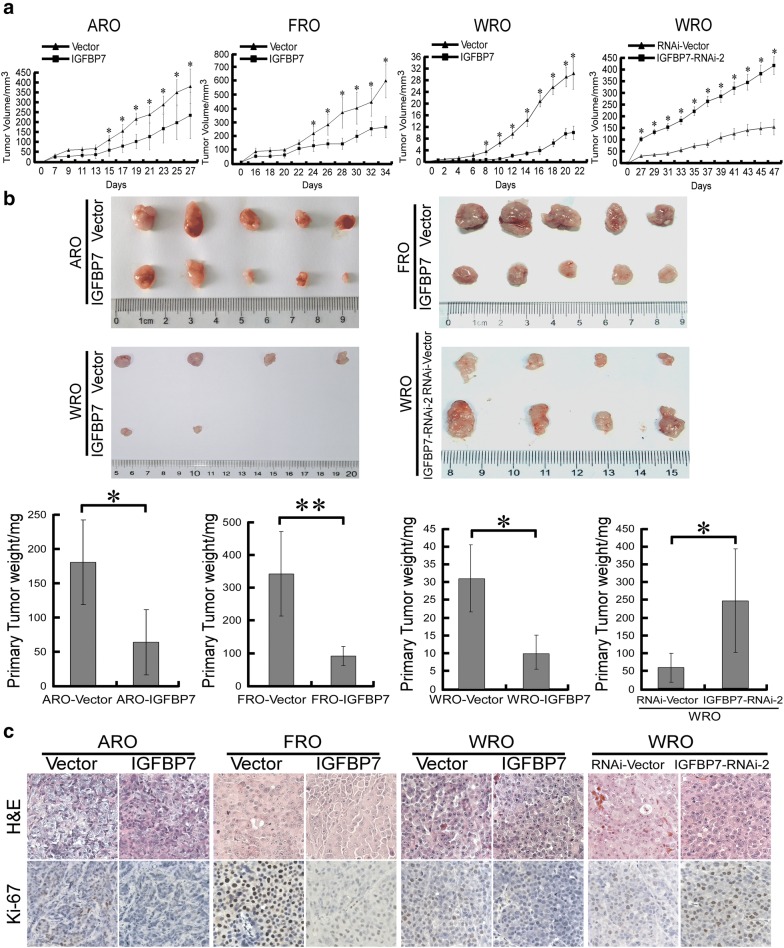
Fig. 3.
IGFBP7 suppresses tumor growth in vivo. a Quantitative analysis of tumor volumes of the indicated cell xenografts at the indicated time points. b Representative image of subcutaneous tumors isolated from nude mice at the experimental endpoint (upper) and quantitative analysis of tumor weights of the indicated cell xenografts (lower). c Tumor tissue sections from the indicated cell xenografts were prepared and proceeded for H&E staining and anti-Ki-67 immunostaining. A two-tailed Student’s t-test was used for statistical analysis (*P < 0.05, **P < 0.01)

