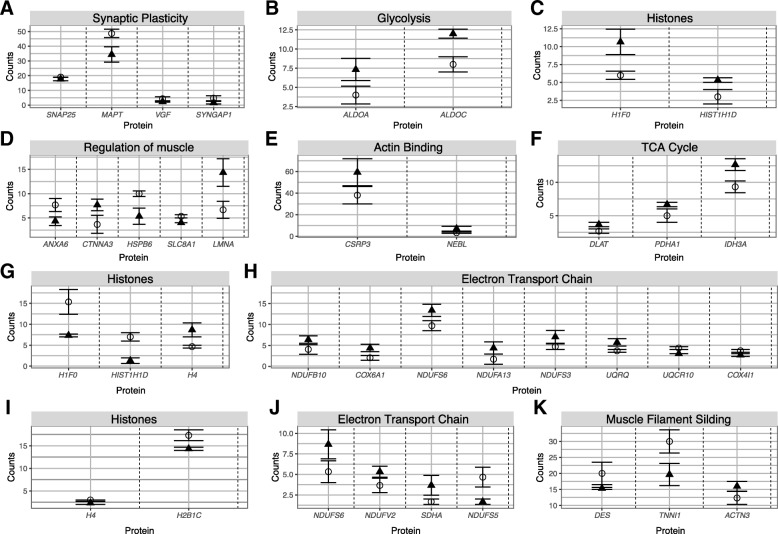
Fig. 3.
Differentially expressed proteins discovered between hibernators and 2 months post-arousal individuals within tissues. Mean (across biological replicates, ± 1 standard error) normalized spectral counts of proteins. Expression is shown for hibernators (triangles) and non-hibernators (circles). Panels a to c display differentially expressed proteins in brain; panels d to h display differentially expressed proteins in heart; and panels i to k display differentially expressed proteins in skeletal muscle. See Additional file 3: Table S3 for fold-changes and full list of protein counts

