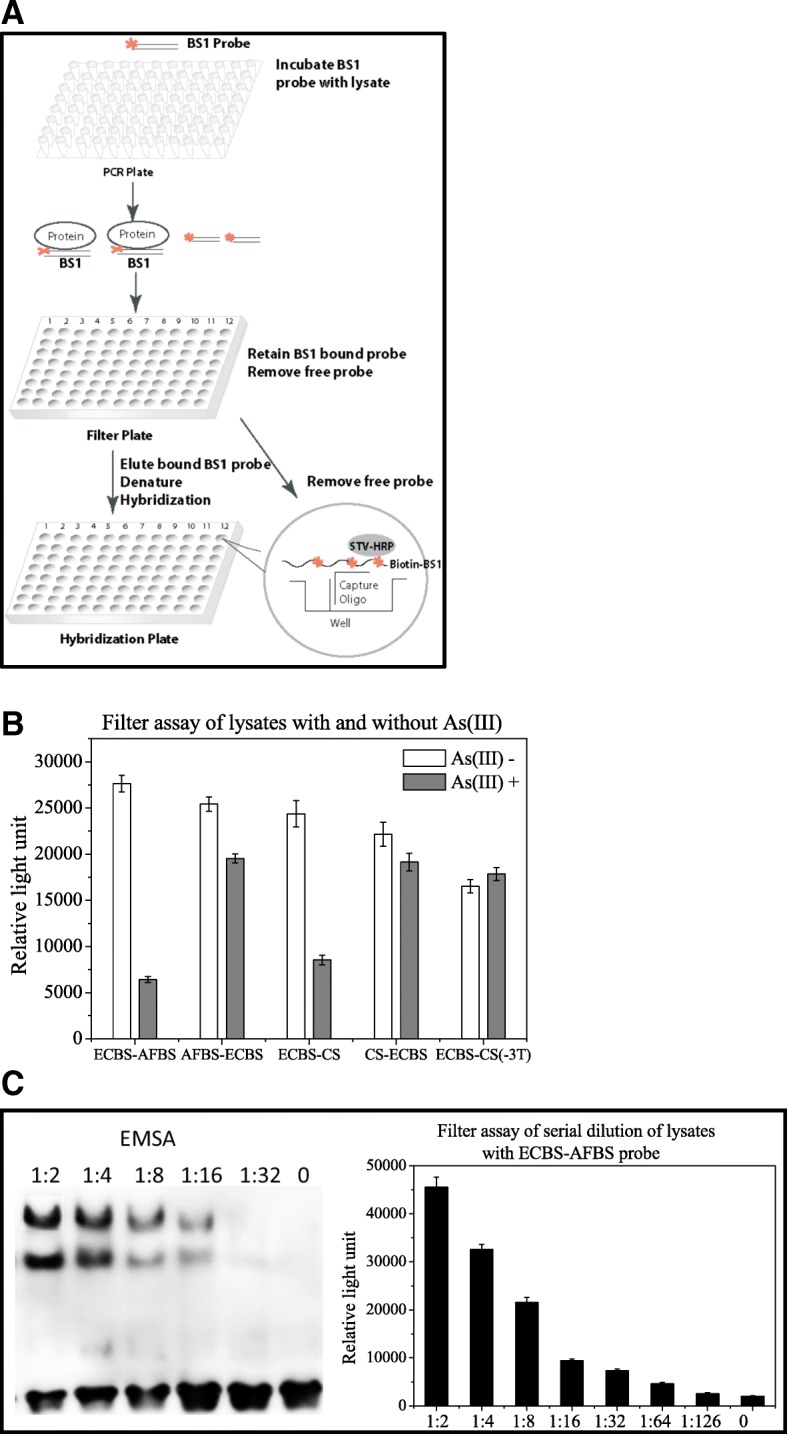
Fig. 4.

Filter assay. a: Schematic diagram of the filter assay comprising 3 steps; the biotin-labeled (* indicates biotin labeled) probe BS1 (Binding Sequence) was first mixed with lysates; BS1 probe bound to the protein in the cell lysate to form protein/DNA complexes; second, the mixture loaded onto nitrocellulose (NC) membrane-based filter plate, the protein/DNA complexes retained on membrane, the free probe washed away, and the protein-bound probe eluted, denatured and hybridized on the hybridization plate; third, the hybridization and detection within one of 96 wells was illustrated in the Cycle. The capture oligos were pre-coated on the bottom of the well, the denatured biotin-labeled probe BS1 hybridized to the capture oligo, and further detected with Streptavidin Horseradish Peroxidase (STV-HRP) and measured with a luminescence plate reader. The luminescence signal directly corresponds to the binding activity. b: Filter assay of probes ECBS-AFBS, AFBS-ECBS, ECBS-CS, CS-ECBS and ECBS-CS(− 3 T) using lysates prepared from cells treated with (grey) and without (open) 10 μM arsenite for 1 h. C: Serial 2-fold dilutions of E. coli DH5α cell lysates were mixed with ECBS-AFBS probe. The mixtures were analyzed with EMSA and the filter assay respectively. The filter assay data shown are the mean values (±standard deviation) obtained from three independent experiments
