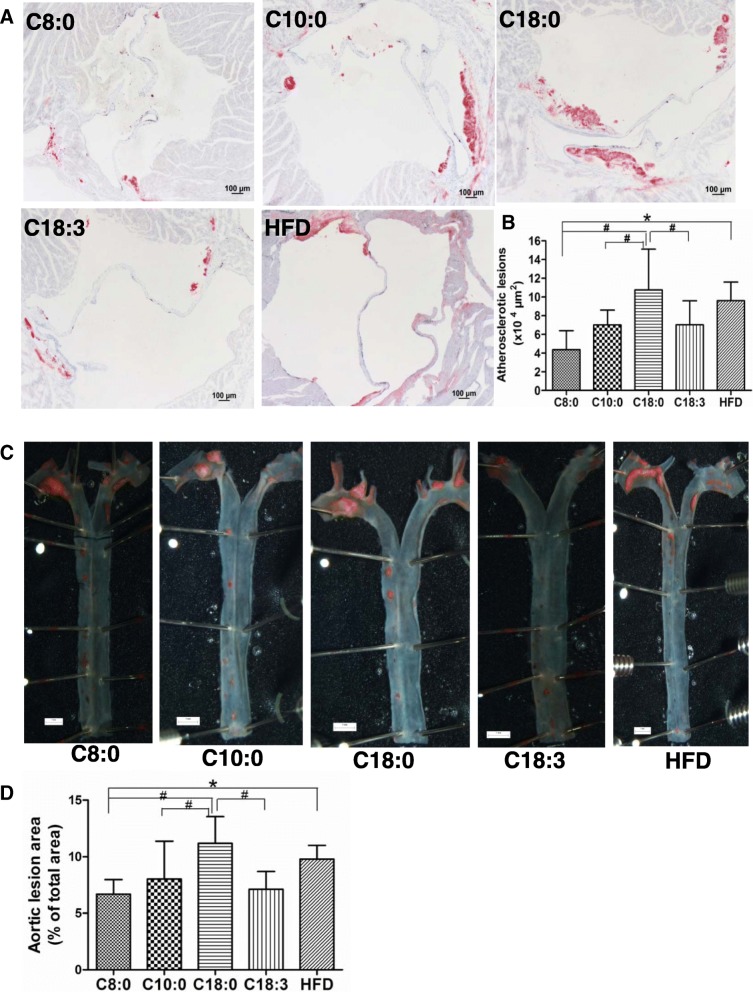
Fig. 5.
The degree of atherosclerosis in the aorta and aortic sinus in the apoE−/− mice. (a) Cross-sections of aortic sinus which were stained by Oil Red O (× 80) (scale bars equal to 100 μm) and (b) corresponding quantitative analysis on dye-positive areas. (c) Representative photographs of aortic lumen stained by Oil Red O (× 5) (scale bars equal to 1 mm) and (d) Quantitative analysis of oil red O-positive areas of the aortic lumen relative to total aortic areas. Data are mean ± S. D of the mean (n = 5). *p < 0.05 versus HFD group; #p < 0.05 versus C18:0 group

