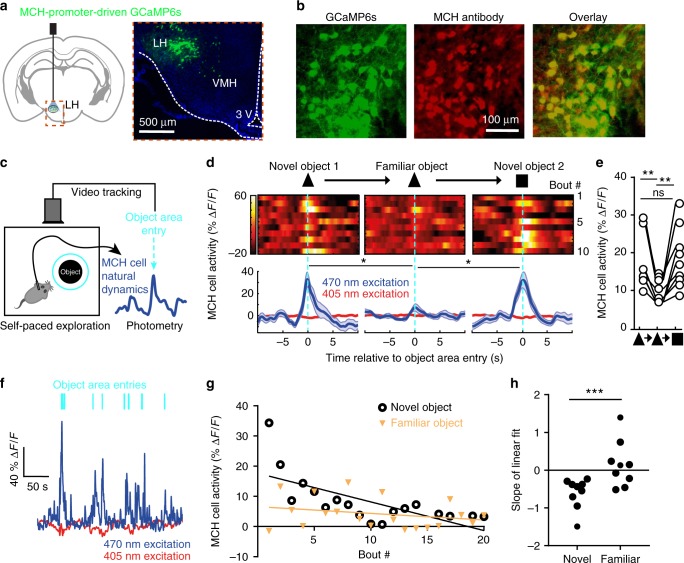
Fig. 1.
Representations of novel objects in MCH cell dynamics. a Targeting scheme (left) and expression (right) of GCaMP6s in MCHLH cells. b Confirmation of GCaMP6s expression in MCHLH cells (see “Methods”). c Schematic (left) of MCHLH cell recording concurrent with behavioral tracking. d Top, representative heatmaps of MCHLH::GCaMP6s fluorescence (at 470 nm excitation) aligned to object-area entry. First 10 object area entries from one mouse (representative data of n = 9 mice). Bottom, group data (means ± s.e.m of n = 10 objects visits for one mouse), also showing negative control from 405 nm excitation. One-way RM ANOVA F(2,27) = 5.505, p = 0.0099, Tukey’s multiple comparisons: Novel object 1(triangle) vs novel object: *p = 0.0227, Novel object vs. novel object 2 (rectangle): *p = 0.0189. e Quantification of peak MCHLH cell activity from D, n = 9 mice. One-way RM ANOVA F(1.694, 13.55) = 16.52, p = 0.0004, Tukey’s multiple comparisons post-tests: novel object 1 (triangle symbol) vs novel object 2 (square symbol) p = 0.9991 (ns), novel object 1 vs familiar object (same object presented 30 min later) **p = 0.0021, familiar object (middle triangle symbol) vs novel object 2 (square symbol): **p = 0.0073. f Representative MCHLH cell responses from one mouse to a sequence of self-paced novel object area entries. g Representative peak MCHLH cell responses from one mouse to a self-paced sequence of novel (NO) and familiar (FO) object area entries; straight lines are linear fits to the data. h Quantification of data in G for n = 9 mice, paired t-test: ***p = 0.0074, t(8) = 3.556

