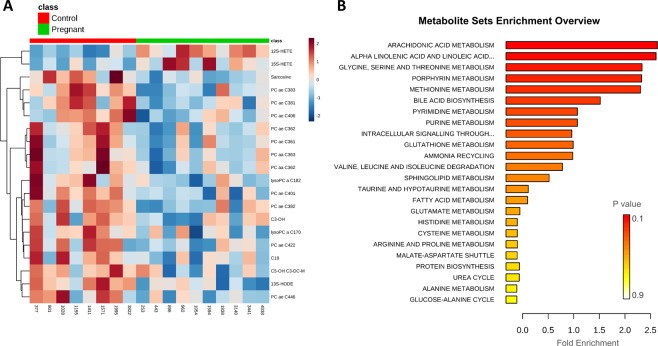
Figure 2.
(A) Heatmap depicting the top 20 metabolites differently abundant between Pregnant and Control ULF samples based on P-values. (B) Quantitative Enrichment Analysis highlighted the metabolic pathways that were enriched in the Pregnant compared to the Control group, using the MetaboAnalyst 4.0 functional interpretation tools. The horizontal bars summarize the main metabolite sets identified in this analysis; the bars are coloured based on their P-values and the length is based on the -fold enrichment.

