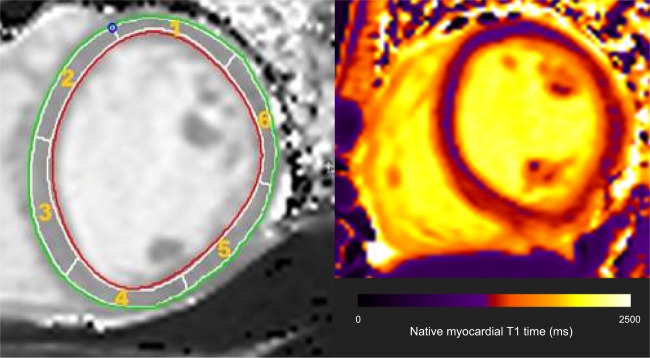
Fig. 1. Showing the circumferential short axis segmentation of a mid-ventricular slice for purpose of native myocardial T1 time calculation, and representative T1 map.
Red and green lines, respectively, represent the endocardial and epicardial borders. Each slice was divided into 6 segments with myocardial T1 time calculated for each segment. Segments with evidence of artefact were excluded from analysis, with the native myocardial T1 time for that participant then calculated as the mean T1 time of the remaining segments

