Fig. 1.
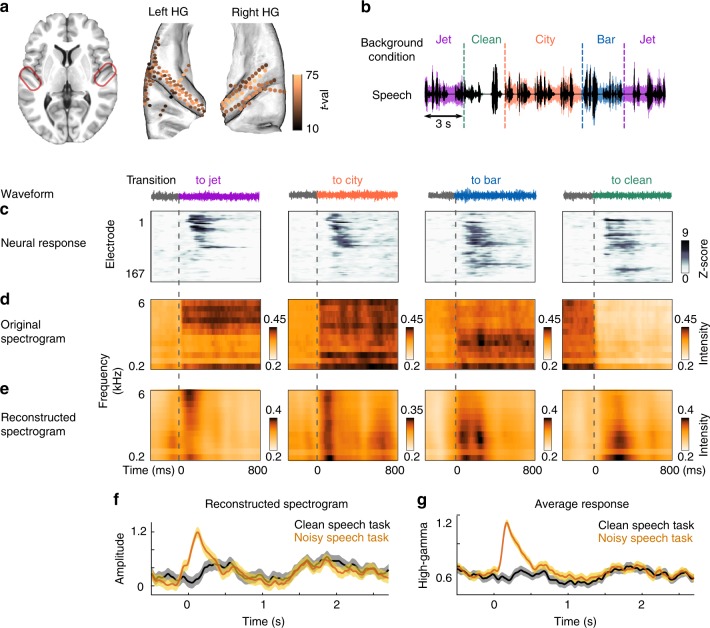
Neural adaptation in transition to a new background condition. a Electrodes with significant response to speech (t-val > 10, t-test speech versus silence), located in Heschl’s gyrus, the superior temporal gyrus, the transverse temporale sulcus and the planum temporale, shown on a BCI-DNI brain atlas. b Experiment design. Clean speech is shown with black; colors show the different background conditions, which change randomly between bar, city, jet, and clean (no noise) every 3 or 6s. c The average normalized neural responses aligned by the time of transition (dashed lines) to each background condition (columns). Electrodes are sorted based on the similarity of their adaptation strength using Unweighted Pair Group Method with Arithmetic Mean (UPGMA) algorithm. d, e Average original spectrograms and reconstructed spectrograms from the neural responses over all transitions to each of the four background conditions. The spectrograms are aligned by the time of transitions. f The reconstructed spectrograms averaged over the frequency dimension are shown for clean speech task and noisy speech task. The reconstruction from noisy speech is the average of all three noisy conditions. Shaded error bars indicate standard error. g Direct comparison of neural responses to noisy speech task and clean speech task normalized based on the responses in the silence interval. Shaded error bars indicate standard error

