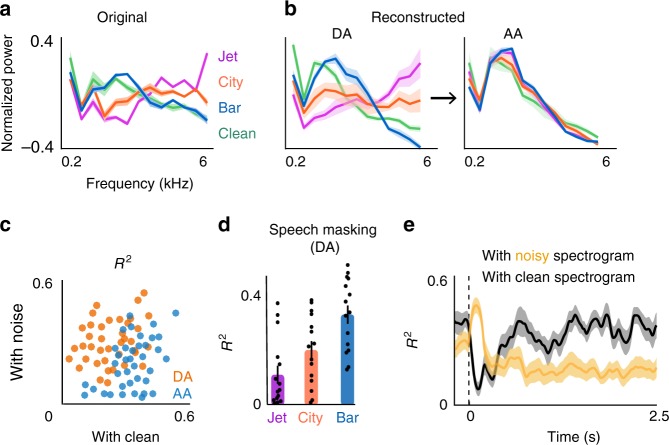
Fig. 2.
Suppression of noise features after transitioning to a new background condition. a Average frequency profile of the four background conditions calculated from the original spectrograms. b Average frequency profile of the background conditions calculated from reconstructed spectrograms during adaptation (DA, 0–0.4s after transition) and after adaptation (AA, 2.0–2.4s after transition) (20% cross-validation for each condition, n = 5). c between reconstructed spectrograms and the original clean (x-axis) and original noisy spectrogram (y-axis) for individual trials. Each dot is the average of five trials. Trials during the adaptation interval (DA, 0–0.4s after transition) are shown with orange, and trials after the adaptation interval (AA, 2.0–2.4s after transition) are shown with blue. d Speech masking calculated based on the overlap of the spectral profile of the reconstructed speech during adaptation and the spectral profile of the reconstructed clean speech (error bars indicate standard error, n = 15). e Time course of the coefficient of determination () of averaged reconstructed spectrograms across subjects with original noisy (yellow) and with original clean (black) spectrograms (20% cross-validations, n = 15). Shaded error bars indicate standard error

