Fig. 5.
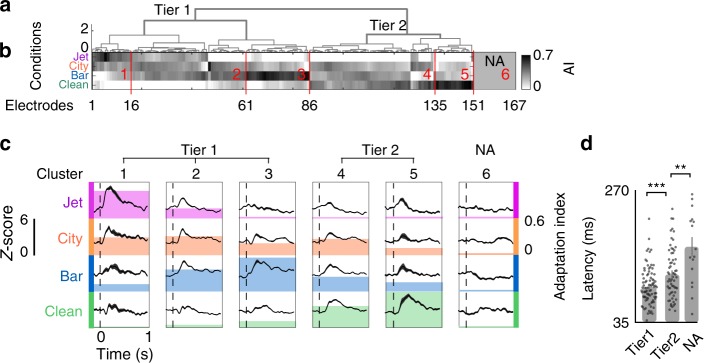
Diversity of adaptation patterns across electrodes. a, b Hierarchical clustering of adaptation indices (AI) across four background conditions. c Average response of electrodes in each cluster to each background condition, aligned by the time of transition. The colored backgrounds show the average adaptation indices for each cluster and condition. d Average latency of electrodes from the top two clusters (tier 1, tier 2) and a nonadaptive cluster (mean ± s.e.m., Ntier1 = 86, Ntier2 = 65, NNA = 16, t-test, **p < 0.05, ***p < 0.01)

