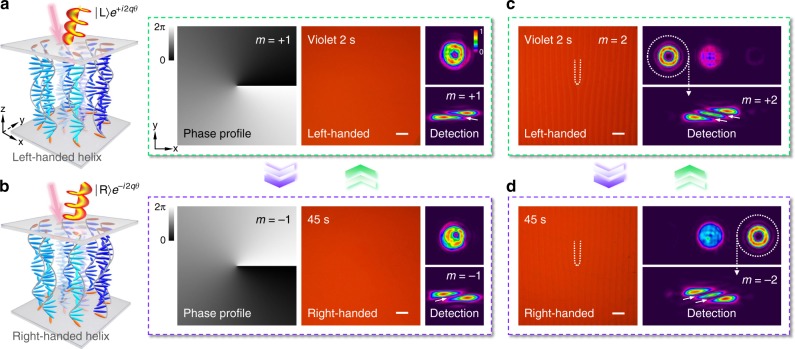
Fig. 5.
Photo-reversible OAM. a, b Schematic illustrations, theoretical phase profiles, micrographs, reflected diffraction patterns and corresponding OAM detections of the light-activated CLC q-plate with q = 1/2 under (a) 2 s and (b) 45 s violet light irradiation, respectively. The CLC directors on the substrates are highlighted in orange. The color variation from black to white indicates the phase varying from 0 to 2π. c, d Micrographs, reflected diffraction patterns and corresponding OAM detections of the linearly gradient phase integrated CLC q-plate (q = 1) under (c) 2 s and (d) 45 s violet light irradiation. All scale bars are 100 μm. The color bar indicates the relative optical intensity

