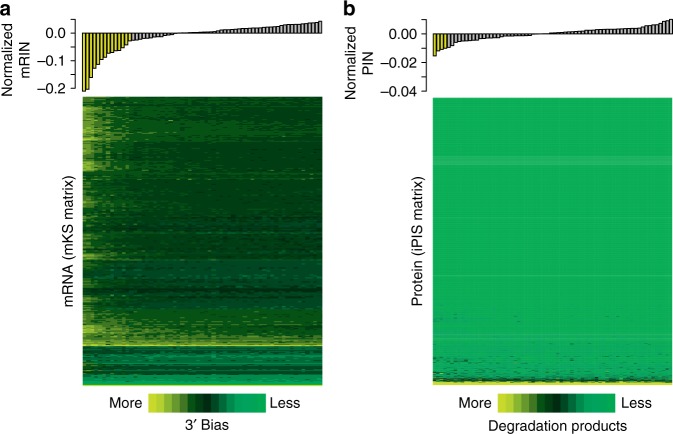
Fig. 4.
Visualization of degradation at the level of individual transcripts and proteins. a Heatmap (bottom) of mKS matrix illustrating the degree of degradation of each individual transcript (rows), with samples (columns) ordered by mRINs. The bar plot (top) displays each sample’s mRIN (median centered). Samples with significant mRNA degradation are highlighted in yellow in the bar plot (n = 68). b Similar to a, but for iPIS matrix with samples ordered by the PIN values. Four samples with significant protein degradation are highlighted in yellow in the bar plot (n = 68)

