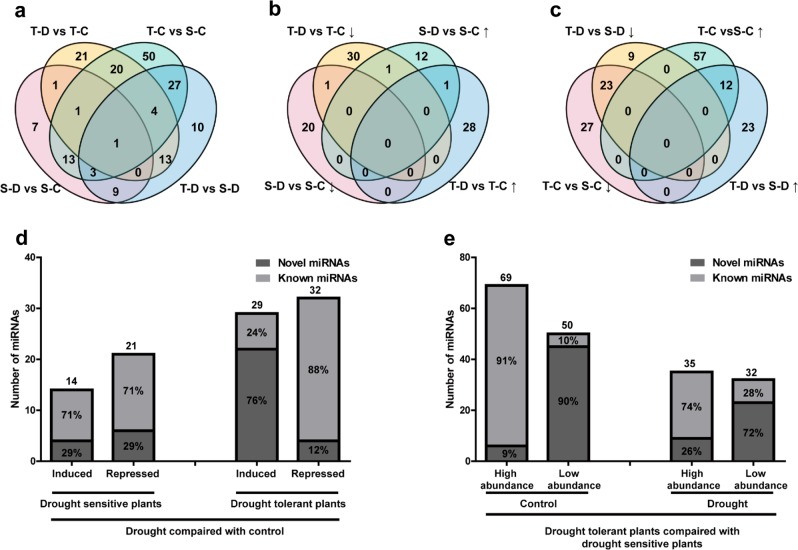
Fig. 5. Diagrams of differentially expressed miRNAs.
a Distribution of miRNA differences among the four comparison groups. b Differentially expressed miRNAs induced or repressed by drought. c Differentially expressed miRNAs in drought-tolerant vs. drought-sensitive plants. d Drought-induced or -repressed novel and known miRNAs in both phenotypes. e High abundant or low abundant miRNAs in drought-tolerant plants under drought treatment or control conditions compared with drought-sensitive plants. S-C: drought-sensitive plants under control conditions; S-D: drought-sensitive plants under drought treatment; T-C: drought-tolerant plants under control; T-D: drought-tolerant plants under drought treatment. Upward arrows indicate upregulation or higher abundance and downward arrows indicate downregulation or lower abundance

