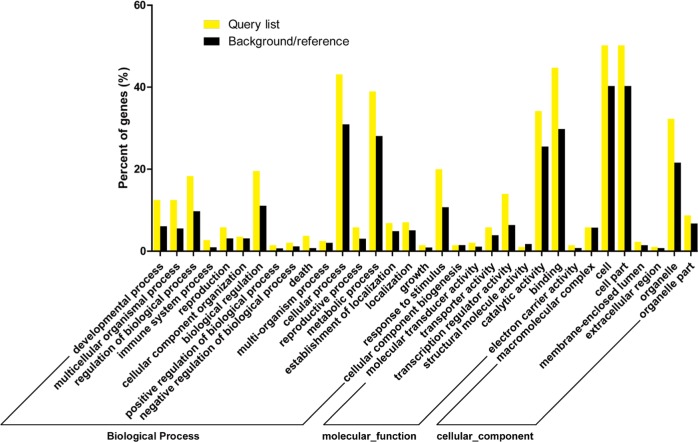
Fig. 7. GO enrichment analysis of the target gene candidates of differentially expressed miRNAs.
The x-axis is the GO term targeting gene enrichment, whereas the y-axis represents the percentage of target genes mapped by the term. The query list (yellow bar) represents the percentage of target genes mapped to the GO term in all genes of the input list. The background/reference list (dark bar) represents the percentage of all GO term genes from all reference database genes

