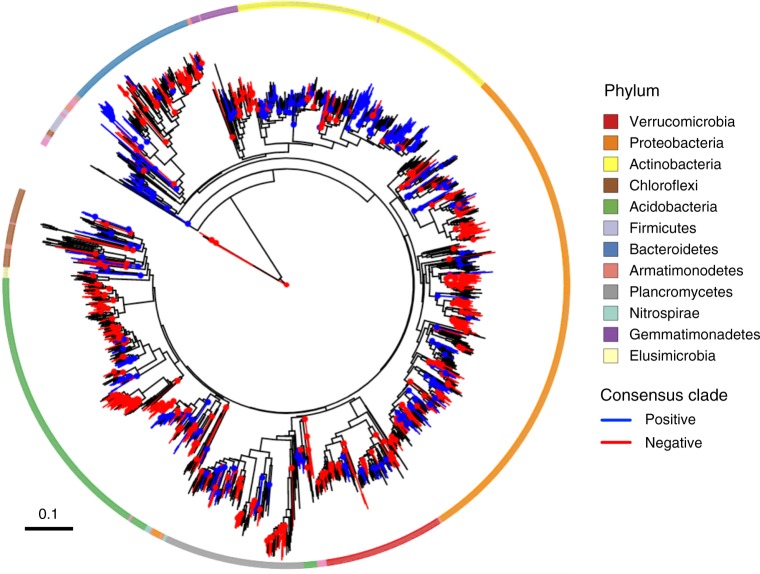
Fig. 3.
Phylogenetic distribution of the averaged response across locations of widespread OTUs (i.e., present at 5 locations or more). Colored nodes and lineages show the consensus clades in which >90% of the descendant OTUs show the same direction of response (blue: positive response, red: negative response). Note that all OTUs in the tree do respond to N, but only consensus clades are colored for clarity. The outer ring shows the phylum-level taxonomy of OTUs determined using the RDP classifier trained on the SILVA database

