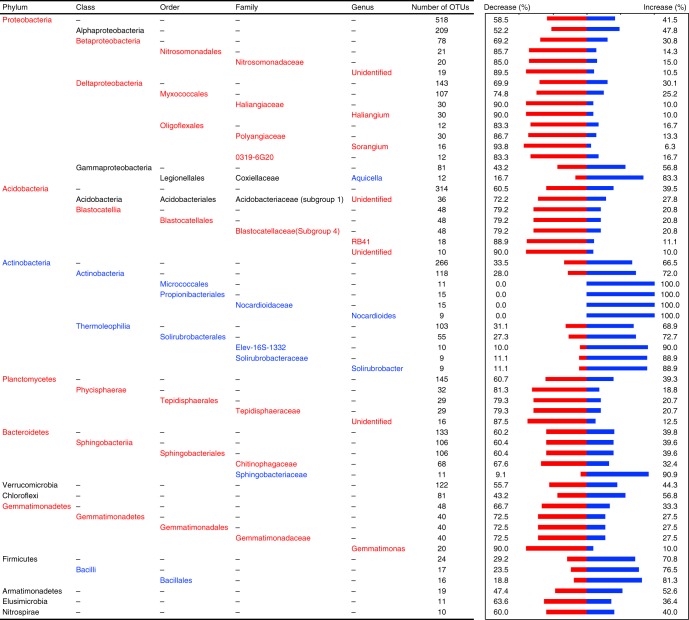
Fig. 4.
Taxonomic groupings whose response to N addition was positive or negative. The response significantly more positive (blue text) or negative (red text) than expected by chance (two-tailed exact test; P < 0.05), based on the response ratios of each OTU calculated in DESeq2, are shown. We also include all phyla (and classes for Proteobacteria) even if they were not significant (black text) for comparison. The percent of OTUs responding positively (blue) or negatively (red) are plotted in the bar graph to the right. Higher taxonomic levels are listed in black (e.g., the order Legionellales) when only the lower levels are significant

