Fig. 4.
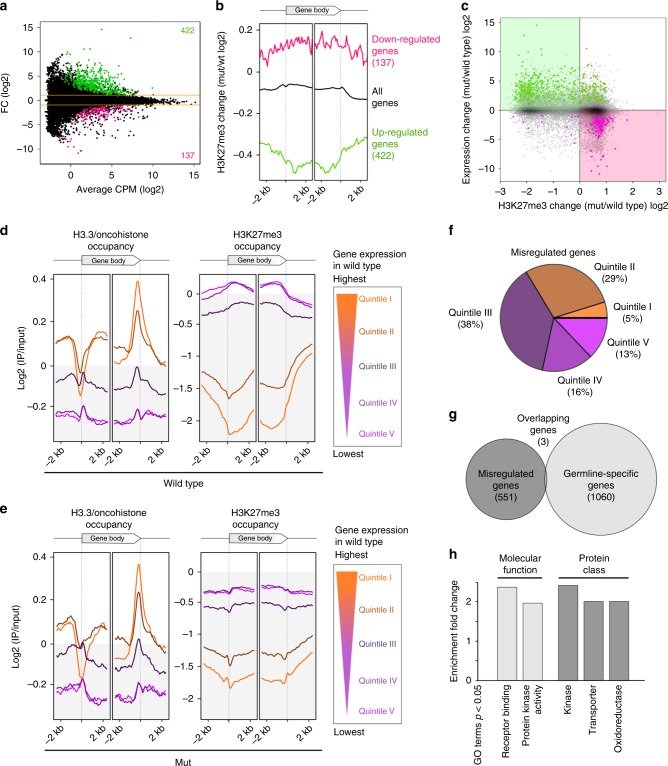
H3.3K27M mutation leads to extensive gene misregulation. a MA plot of RNA sequencing results showing genes up- (green) and downregulated (magenta) in H3.3K27M mutant (mut) compared with wild-type worms. b Average plots of H3K27me3 occupancy changes in mut compared with wild-type worms at all genes, and at genes up- (green) or downregulated (magenta) upon H3.3K27M mutation. c Scatter plot of H3K27me3 and expression changes upon H3.3K27M mutation for all genes. Upregulated genes are marked with magenta, and downregulated genes are marked in green. d–e Average plots showing H3.3 and H3K27me3 occupancy over gene bodies, with genes divided into quintiles based on wild-type levels of expression, in wild-type worms (d) and mut worms (e). f Pie chart showing proportions of misregulated genes in mut worms in each expression quintile. g Venn diagram showing the overlap between genes misregulated in mut worms and germ-line-specific genes42. h Bar plot showing GO Terms significantly enriched among genes misregulated in mut worms. GO Terms were called in two categories (molecular function and protein class), and only GO Terms enriched ≥ 2 fold are shown

