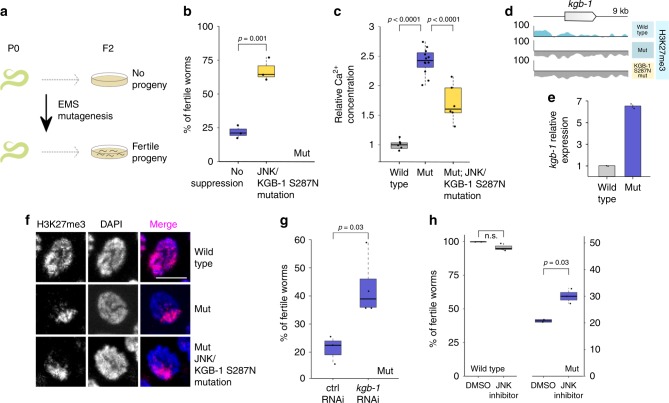
Fig. 5.
JNK inhibition counteracts phenotypes caused by H3.3K27M mutation. a Cartoon showing experimental setup for the random EMS mutagenesis. P0 worms were mutagenized, and individual F2 worms were screened for fertility that was maintained for several subsequent generations at 25 °C. b Fertility boxplot for H3.3K27M mutant (mut) worms with (yellow) and without (blue) KGB-1/JNK S287N suppressor mutation. N = 3 for all conditions. c Boxplot showing relative Ca2+ concentration in gonads of wild type (gray), mut (blue) and mut; KGB-1/JNK S287N (yellow). Concentration in wild type was set as one and used as a reference for the other strains. N = 6 for wt, N = 12 for mut, N = 6 for mut; KGB-1/JNK S287N. d Genome browser view showing H3K27me3 levels around the kgb-1 gene in wild-type, mut and mut; KGB-1/JNK S287N worms. e Bar plot showing the kgb-1 expression levels in wild-type and mut germ lines based on RNA-seq (bottom). Error bars are standard deviations. f H3K27me3 staining in wild type, mut and mut; KGB-1/JNK S287N. Scale bar represents 5 µm. g Fertility boxplots of mut worms upon treatment with control (left) or kgb-1/JNK (right) RNAi. N = 3 for control, N = 4 for kgb-1 RNAi. h Fertility boxplots of wild-type (gray) and mut (blue) worms upon treatment with DMSO or JNK inhibitor SP600125. N = 3 for inhibitor and N = 2 for DMSO treatment. Significance was tested for using student’s t-test

