Figure 2.
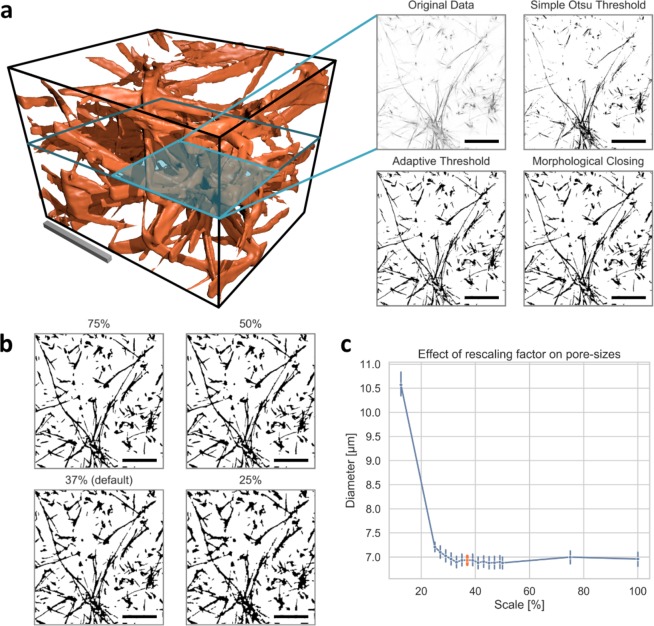
3D collagen network binarization method. (a) Left image: Representative image cube of a TAMRA-labelled collagen scaffold. Top left image: A representative 2D slice of original image data is shown. Top right image: A common approach using best threshold based on Otsu’s method28 is provided. Bottom left image: An adaptive local threshold of a denoised image is presented. Bottom right image: The final segmentation result is shown. (b) The effect of down-sampling of the x-y resolution on the segmentation is presented for selected percentages. (c) Effect of rescaling on the pore-sizes, selected 37% highlighted in orange. All scale bars are 20 µm.

