Figure 6.
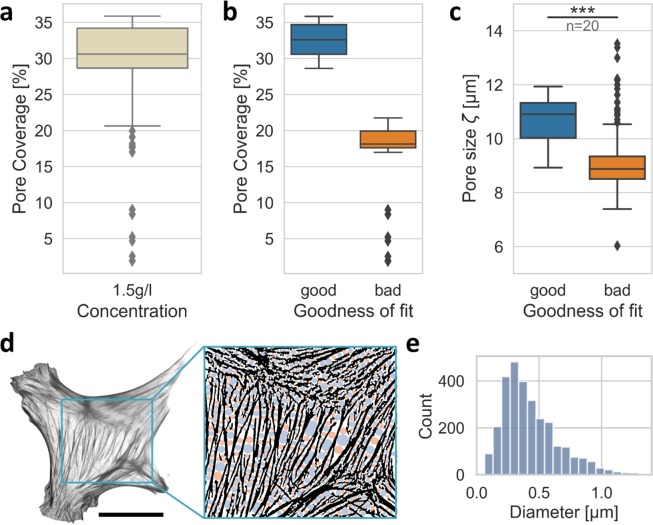
Pore coverage as a goodness-of-fit parameter for collagen networks and applicability to actin bundle networks. (a) The pore coverage of both normal and manipulated collagen samples taken as a single measurement. (b) The samples are categorized as ‘good’ (not mechanically perturbed) and ‘bad’ (mechanically perturbed) samples based on their pore coverage. (c) Clearly distinguishable pore-sizes of the good and bad samples show that the “flawed” (bad) samples scatter broadly and have a drastically altered pore size. (d) Left image: greyscale image of actin bundle network of an exemplary mouse embryonic fibroblast (MEF). Scalebar is 20 µm. Left image: illustration of segmentation and detected pores. (e) Histogram of actin bundle pore-sizes determined for three exemplary MEFs.

