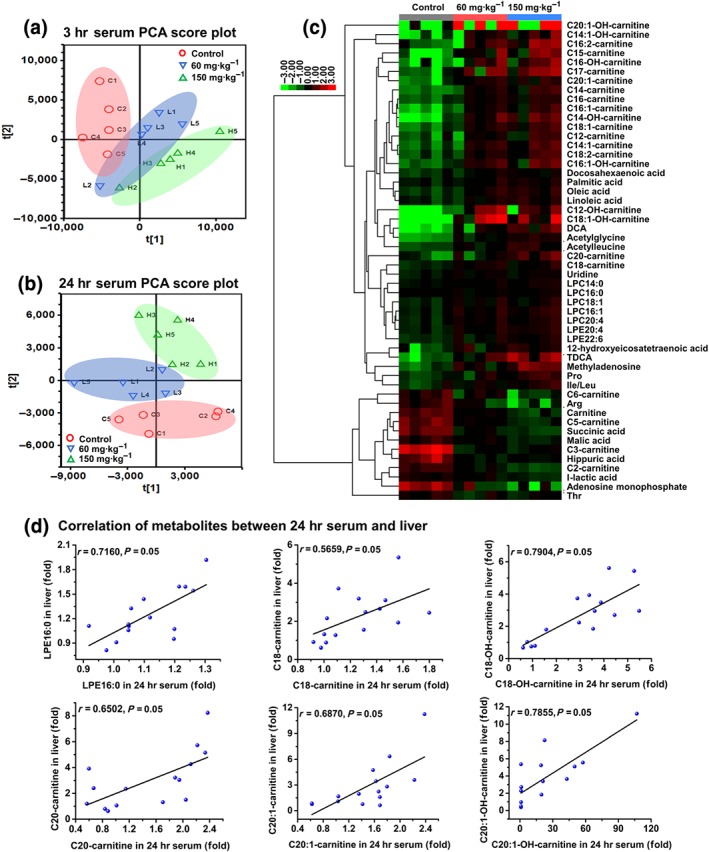
Figure 3.

Sunitinib altered the serum metabolome. Principal component analysis (PCA) score plot derived from ultra‐performance LC electrospray ionization quadrupole time‐of‐flight MS data of 3 hr serum (a) and 24 hr serum (b) ions. Each point represented an individual mouse sample. (c) Heatmap of 52 significantly changed endogenous metabolites in 3 hr serum. (d) Correlation of metabolites between 24 hr serum and 24 hr liver. Six endogenous metabolites showed a good correlation between 24 hr serum and 24 hr liver (n = 5). Arg, arginine; DCA, deoxycholic acid; Ile, isoleucine; Leu, leucine; LPC, lyso‐phosphocholine; LPE, lyso‐phosphatidylethanolamine; Pro, proline; TDCA, taurodeoxycholic acid; Thr, threonine
