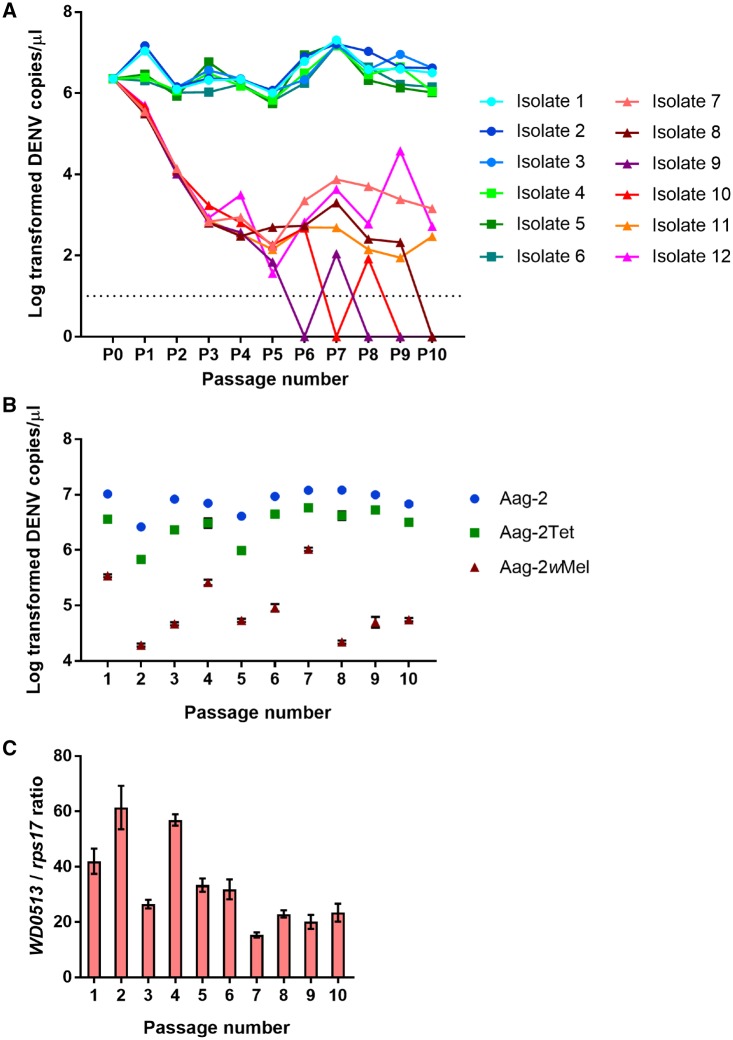
Figure 1.
Sequential passaging of twelve DENV-3 isolates in Aag-2, Aag-2Tet, and Aag-2wMel cells. (A) Log10 transformed viral genome copies of the twelve isolates at every passage, as measured via qRT-PCR. Blue-themed circles denote Aag-2-passaged isolates (1–3). Green-themed squares denote Aag-2Tet-passaged isolates (4–6). Red-themed triangles denote Aag-2wMel-passaged isolates (7–12). Data points at 0 log10 copies/µl indicate that viral loads were below detection limits, which are at ten genome copies/µl (dotted line). (B) Log10 transformed viral genome copies in three cell lines inoculated with P0 to verify Wolbachia-induced blocking phenotype at five days post-inoculation. Mean and SEM are shown in graphs (n = 5 per cell line). (C) Wolbachia densities in Aag-2wMel cells at every passage measured as the ratio of Wolbachia gene WD0513 to mosquito gene rps17.

