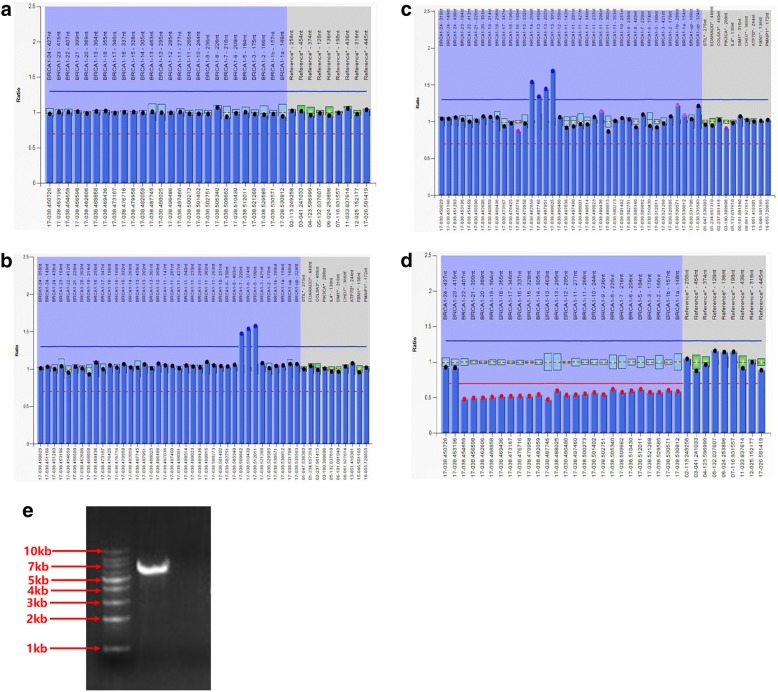
Fig. 1.
Three BRCA1 LGRs detected in the HBOC cohort. MLPA result for BRCA1 LGRs in bar chart format generated by Coffalyser software v.9. BRCA1 exons and intra normalized ratio are given on the X axis and Y axis, respectively. Exons having reduced or increased peak ratio are denoted by red or blue dot, respectively. a MLPA result for BRCA1 wildtype. b exon5-7dup. c exon13-14dup. d exon1-22del. e exon5-7dup was confirmed by LR-PCR

