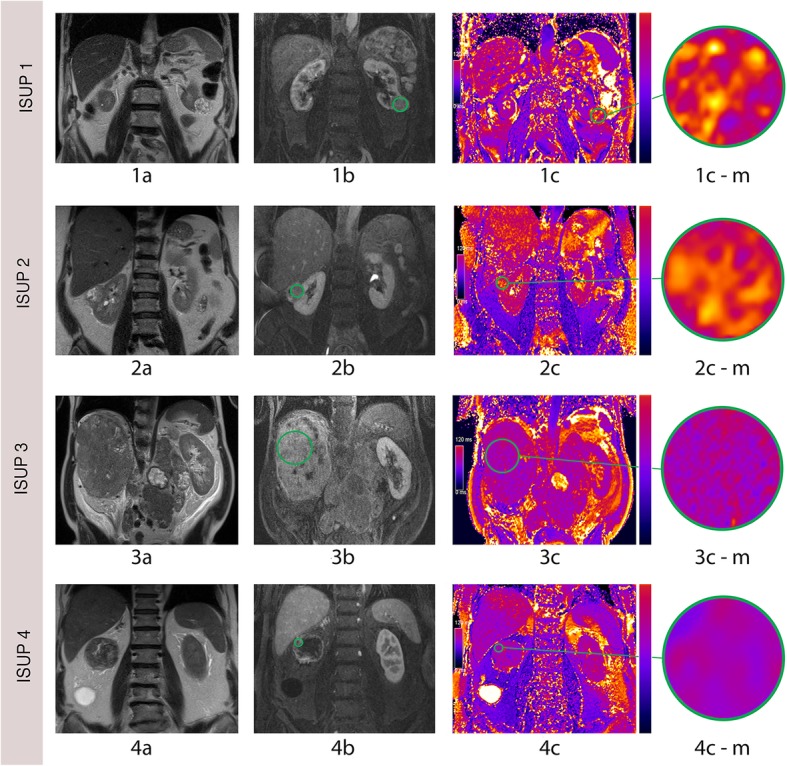
Fig. 3.

Exemplary T2 mapping images of lower and higher grade cRCC. 1a, coronal T2 HASTE image of a 77-year-old man with a low grade (ISUP 1) cRCC of the left kidney. 1b, postcontrast T1 FLASH image. 1c, corresponding TrueFISP image, showing a high T2 signal. 2a, T2 HASTE image of a 57-year-old woman with a lower grade (ISUP 2) cRCC of the right kidney. 2b, postcontrast T1 FLASH image. 2c, corresponding TrueFISP image, also showing a high T2 signal (2d). 3a, coronal T2 HASTE image of a 62-year-old man with a higher grade (ISUP 3) cRCC of the right kidney. 3b, postcontrast T1 FLASH image. 3c, corresponding TrueFISP image, showing a low T2 signal. 4a, coronal T2 HASTE image of a 71-year-old man with a high grade (ISUP 4) cRCC of the right kidney. 4b, postcontrast T1 FLASH image. 4c, corresponding TrueFISP image, showing a low T2 signal. 1c-m1, 2c-m1, 3c-m1 and 4c-m1 are magnifications of 1c, 2c, 3c and 4c
