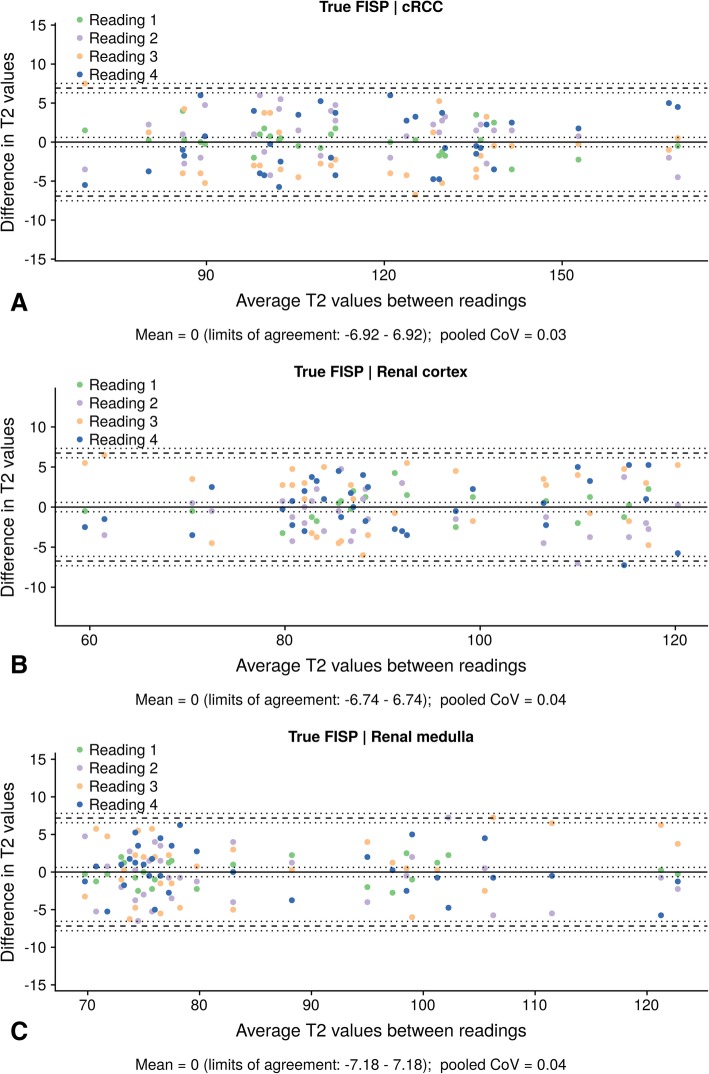
Fig. 4.
Intraobserver agreement of cortex, medullary and tumor T2 values. Bland-Altman plots, showing agreement between four different readings for measurement of T2 values (a, tumor tissue; b, renal cortex; c, renal medulla). The upper and lower reference lines indicate the upper and lower limits of agreement (95% confidence intervals). The confidence intervals for the mean and limits of agreement are indicated by the dotted lines. CoV: Coefficient of variation

