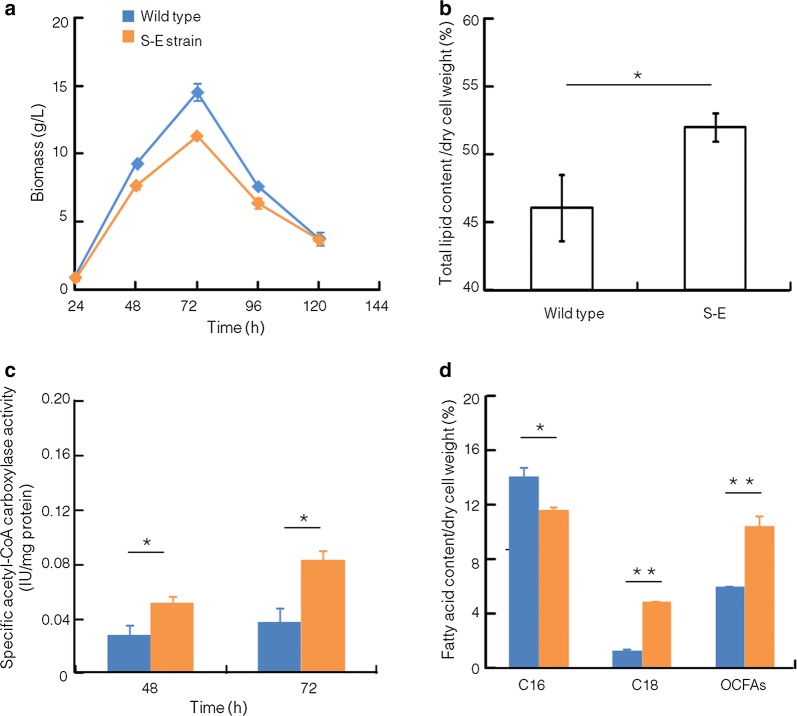
Fig. 2.
Comparison of growth curves, lipid contents and acetyl-CoA carboxylase activity between wild type and S-E. a Growth curves; b lipid content; c acetyl-CoA carboxylase activity; d fatty acid contents. blue: wild type; orange: S-E strain. *p < 0.05; **p < 0.01. C14, C14:0; C16, C16:0; C18, C18:0 and C18:1; OCFAs, odd-chain fatty acids (C15:0 + C17:0)

