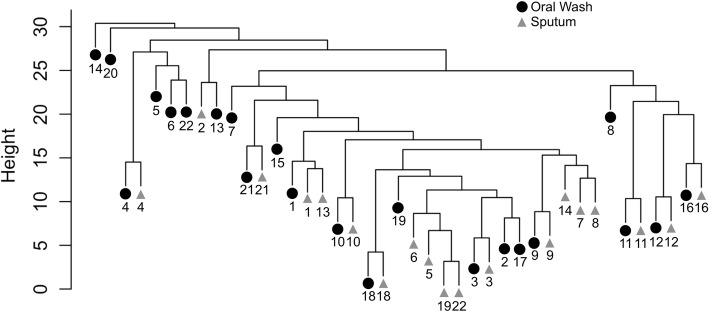
Fig. 6.
Hierarchical clustering illustrates within-subject similarity. Oral samples (circles) and sputum samples (triangles) are represented on this clustering diagram, with subject ID provided at bottom. With the exception of samples from frequent exacerbators 5, 19, and 22, subject ID (rather than sample type or exacerbation phenotype) was the primary driver of clustering. The exceptions to this were FE subjects 5, 19, and 22, whose sputa were dominated by Haemophilus or Moraxella while their oral wash samples were not dominated by these taxa. No sample pairs from IE subjects exhibited such large separations between samples

