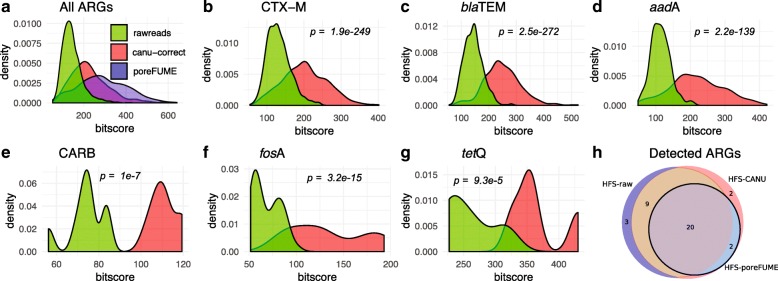
Fig. 6.
Comparison of error correction approach applied to a functional metagenomic sample. Comparison against raw reads and error-corrected reads using CANU correct and poreFUME. p values were computed between the different distributions using a t test. a Bit score distribution of all ARG alignments. b–d Comparison between raw and corrected reads using CANU correct for ARGs with high depth. e–g Bit score distribution for raw and corrected reads for low depth ARGs. h Venn diagram showing discovered ARGs by raw and corrected reads by CANU and poreFUME

