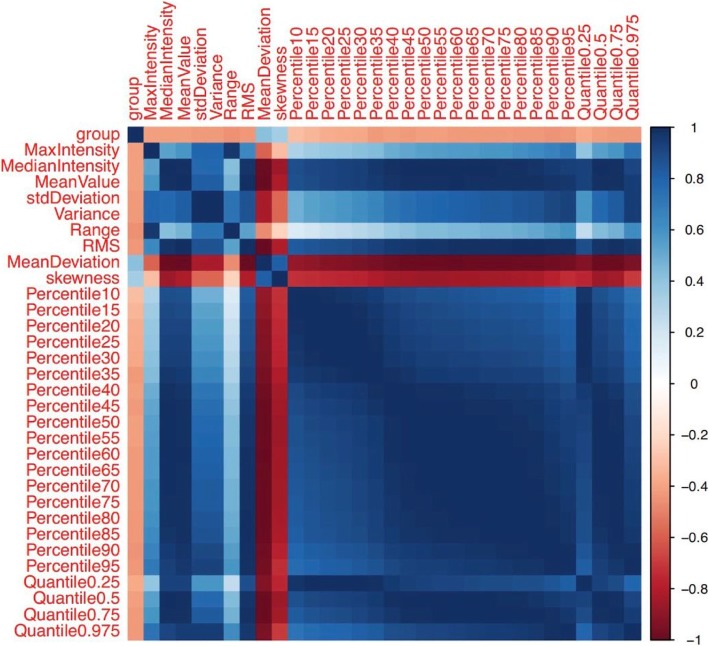
Fig. 4.
The correlation heat map. Thirty-one features were maximally relevant to the EGFR status based on the first selection step. Spearman correlation coefficient matrix, used to eliminate redundancy in the second step, is shown in the heat map. For the color scale, dark blue indicates a positive correlation, while dark red indicates a negative correlation. The deeper the color, the stronger the relationship. “Group” indicates the EGFR status confirmed by gene detection. |R| > 0.9 was considered to indicate a strong relationship with each other, in which one of the two features was eliminated. Finally, range, skewness, and quantile 0.975 remained the representative features

