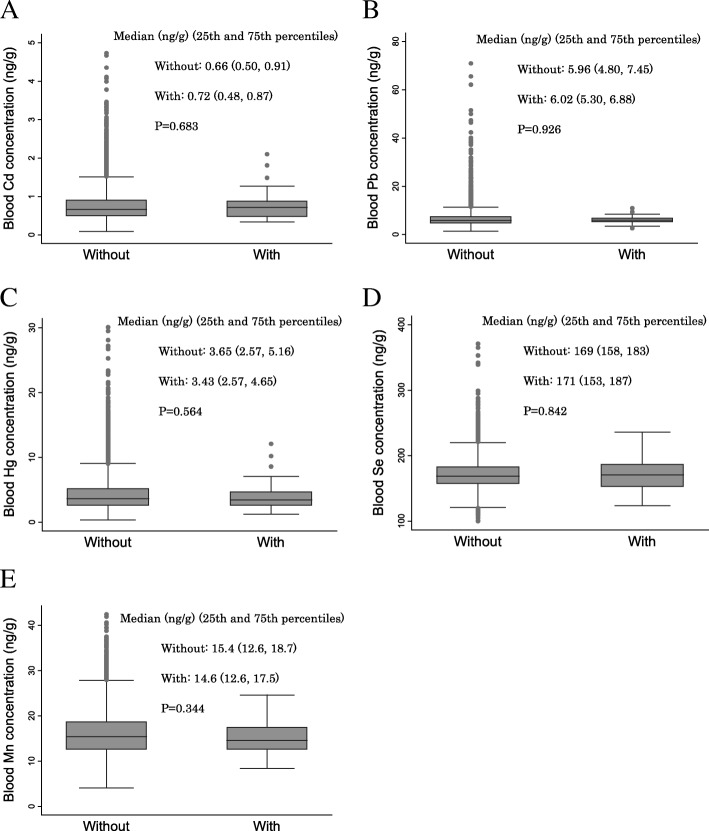
Fig. 3.
Relationships between metal concentrations in the blood and placenta accreta. The relationships between metal concentrations in the second/third trimester (T2) blood and placenta accreta are shown. A box plot displays a box bordered at the 25th and 75th percentiles of the variable on the y-axis with a median line at the 50th percentile of each metal concentration. p values were calculated using the Mann-Whitney U test. a Relationship between Cd concentration and placenta accreta. b Relationship between Pb concentration and placenta accreta. c Relationship between Hg concentration and placenta accreta. d Relationship between Se concentration and placenta accreta. e Relationship between Mn concentration and placenta accreta. Cd, cadmium; Pb, lead; Hg, mercury; Se, selenium; Mn, manganese

