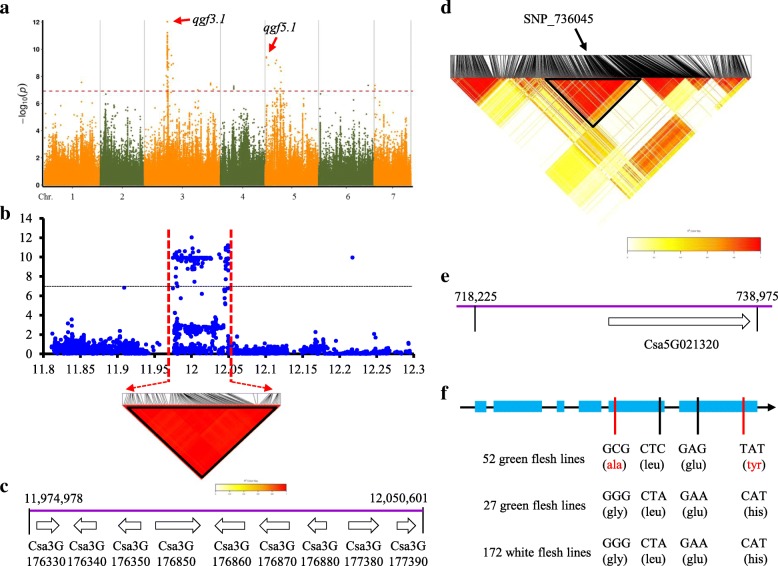
Fig. 6.
GWAS for flesh chlorophyll content and identification of the causal gene for the peak on chromosome 3 and 5. a Manhattan plot for flesh chlorophyll content. Dashed line represents the significance threshold (−log10 P = 7.00). Arrowheads indicate the position of strong peaks. b Local Manhattan plot (top) and LD heatmap (bottom) surrounding the peak on chromosome 3. Dashed lines indicate the candidate region (~ 75 kb) for the peak. c Nine genes were predicted in the qgf3.1 candidate region. d LD heatmap based on the SNPs located on the 100 Kb region surrounding the SNP_736045 peak. e The candidate gene of qgf5.1 was detected in the block region (~ 20 kb). f SNP variation in the natural population. 251 cucumber lines were used for the candidate gene alignment. The red color means the change of SNP results the amino acid change

