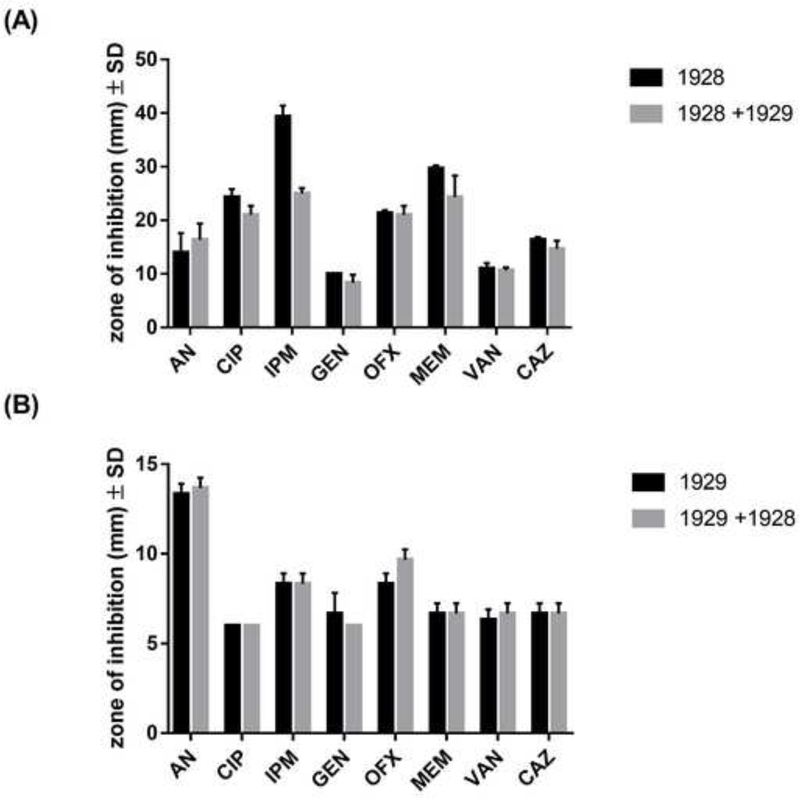
Figure 2. Antibiotic susceptibility profiles of S. aureus 1928 and A. baumannii 1929 in mono and co-culture condition.
Zone of inhibition represents the average ± Standard deviation in the halo sizes. (A) S. aureus 1928 mono and co-culture with A. baumannii 1929. (B) A. baumannii 1929 mono and co-culture with S. aureus 1928. Bars and whiskers represent means ± SD of three independent experiments in duplicate. The differences between mono and co-culture were analyzed by two-way ANOVA by Sidak’s comparison test.

