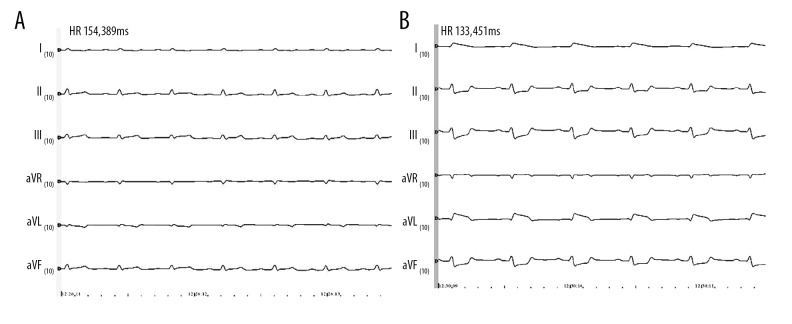
Figure 1.
Electrocardiogram before and after myocardial infarction. A is an electrocardiogram before ligating the coronary artery, and B is an electrocardiogram 30 minutes after ligating the artery. Compared with before ligation, the ST segment was significantly elevated 30 minutes after the artery was ligated. It was confirmed that the myocardial infarction model was successfully constructed.

