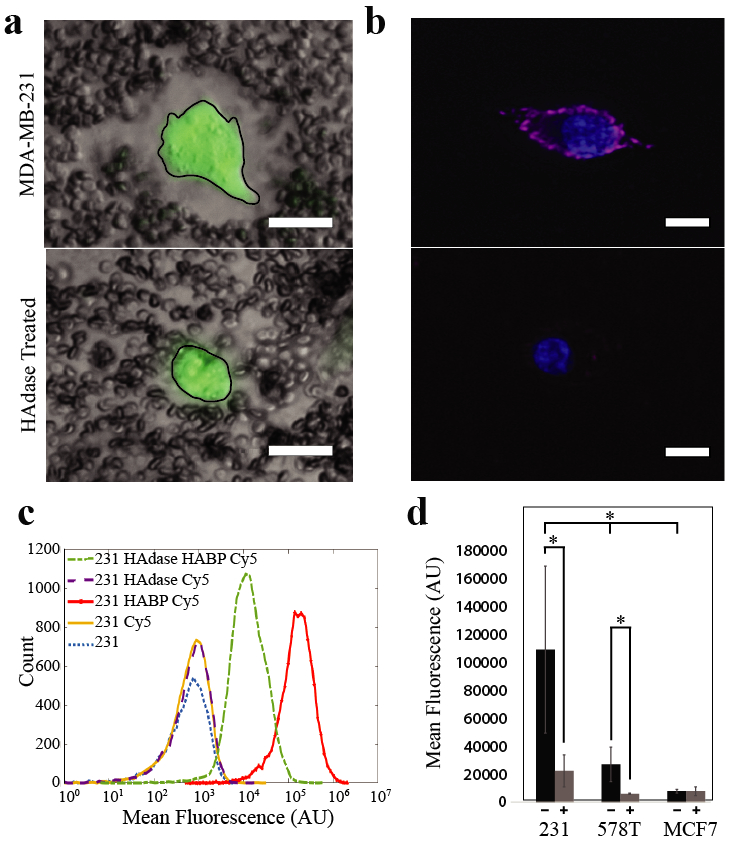
Figure 1. Tumor cell pericellular matrix correlates with in vivo metastatic potential.

a) Particle Exclusion Assay. The negative charge of aggrecan bound to HA in the pericellular matrix repels negatively charged fixed sheep red blood cells creating space around the cell (outlined in black), top. After treatment with hyaluronidase (HAdase), the sheep red blood cells are close to the cell membrane demonstrating the removal of HA from the cell surface, bottom. Scale bar 20 μm. b) Pericellular HA on live MDA-MB-231 cells with and without hyaluronidase treatment was stained with biotinylated HABP and streptavidin-Cy5 (pink). Nuclei are shown in blue. Scale bars denote 10 μm. c) Histogram of HABP-Cy5 labled MDA-MB-231 breast cancer epithelial cells with and without hyaluronidase treatment. Treating MDA-MB-231 cells with hyaluronidase reduced fluorescence, denoting a change in HA on the cell surface by an order of magnitude. This is visualized as a shift from the peak on the far right representing untreated cells (red) to the peak in the middle representing hyaluronidase treated cells (green). d) Comparison of cell surface HA across cell types. MDA-MB-231 cells have highest mean fluorescence of cell surface HA before hyaluronidase treatment and the biggest change in mean fluorescence of cell surface HA after treatment. The less metastatic HS578Ts have significantly less cell surface HA in untreated cells than MDA-MB-231 cells. Hyaluronidase treatment of HS578Ts significantly reduced cell surface HA. Cell surface HA levels in the least-metastatic MCF7 cells was lowest of all untreated cell types and there was no significant change in the cell surface HA after hyaluronidase treatment. *p < 0.05 and **p < 0.01.
