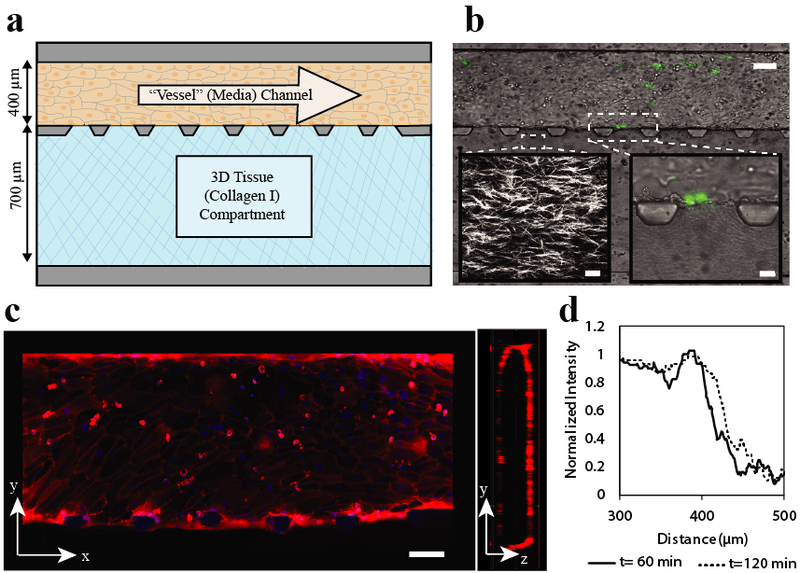
Figure 2. An in vitro microfluidic model of metastatic extravasation and invasion.

a) Device design. Device consists of two adjacent channels separated by trapezoid-shaped posts. The top perfusion channel (dimensions 100 μm high × 400 μm wide × 10 mm long) is attached to a resistor that slows flow to create physiologically relevant shear (resitor not shown). Endothelial cells are seeded in this perfusion channel and form an endothelial monolayer around the channel. The bottom tissue compartment (100 μm high × 700 μm wide × 10 cm long) is filled with collagen that is polymerized to create a 3D tissue adjacent to the endothelial monolayer. b) Brightfield image of experimental imaging area with MDA-MB-231 eGFP cells adhered to the endothelium and beginning to transmigrate. Scale bar 100 μm. Left inset: Second harmonic generation microscopy image of collagen fibers after polymerizaion. Scale bar 20 μm. Right inset: Brightfield image of MDA-MB-231 eGFP cells beginning transmigration into the tissue compartment. c) Walls of endothelial perfusion channel. Tight junctions of endothelial cells are stained with CD-31 (red), nuclei with hoescht (blue). These images show that there is a coherent layer of endothelial cells on all four sides of the channel walls. Scale Bar 100 μm d) Diffusion profile across the endothelial barrier. To measure endothelial permeability to protein sized molecules, 48 μg/ml 150 kDa TRITC dextran was added to the endothelial cell coated perfusion channel. A line scan of the normalized fluorescent intensity, shown here, illustrates the behavior of the endothelial barrier over time. The endothelial barrier is evident as a sharp drop in fluoresence intensity and shows a slight increase at two hours as fluorescent tracer slowly passes through.
