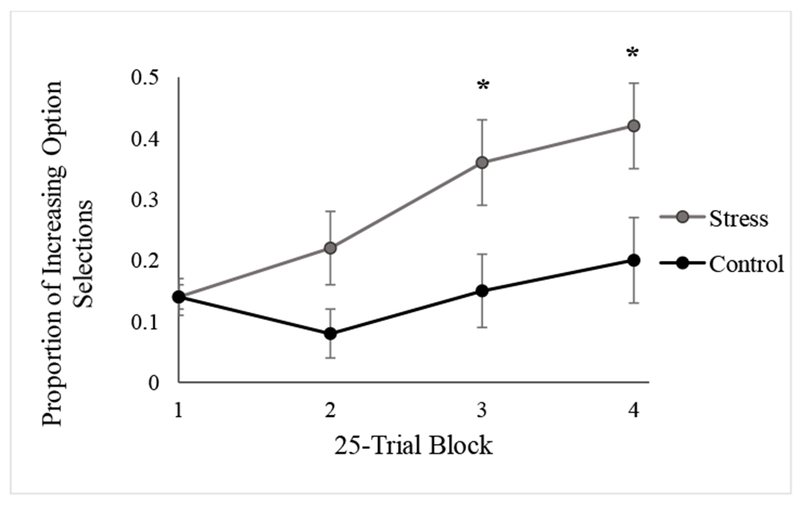
Figure 3.

Proportion of optimal Increasing option selections in each 25-trial block in Experiment 1 by condition. Asterisks indicate significant group differences between the stress and control conditions at a threshold of p < .05. Error bars represent standard error of mean.
