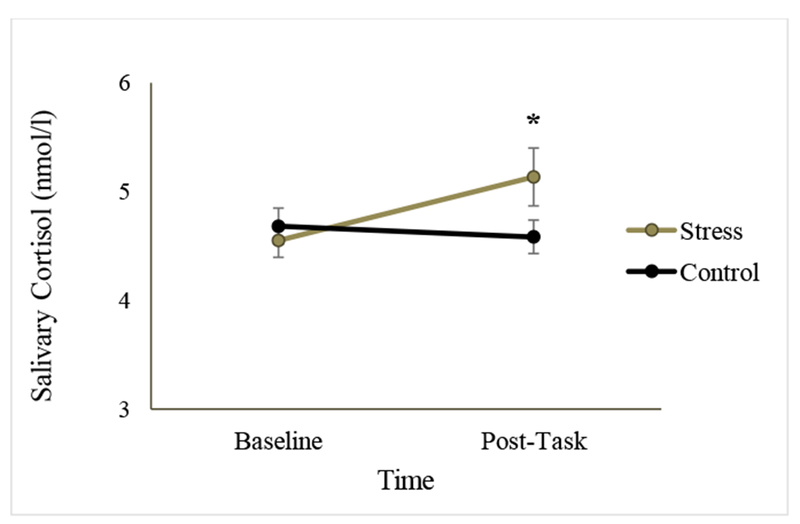
Figure 5.

Salivary cortisol concentrations in the stress and control condition in Experiment 2. Asterisks indicate a significant interaction between condition (stress vs. control) and time point (baseline vs. control) at a threshold of p < .05. The increase in cortisol levels was significant for the stress condition from baseline to post-task time points, but not for the control condition. Error bars represent standard error of mean.
