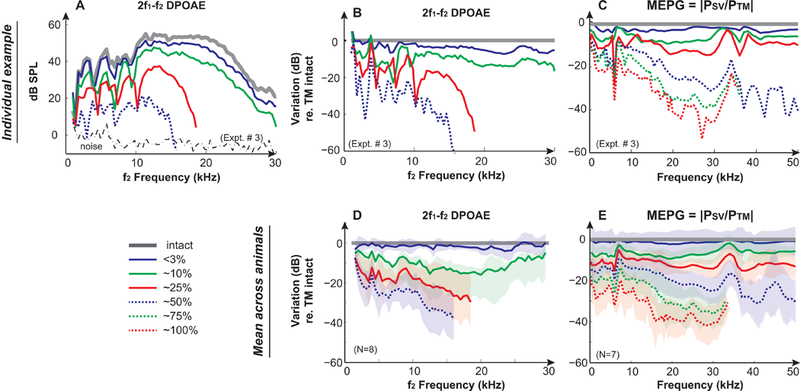
Figure 2. Effects of mechanically induced TM perforations on DPOAEs and MEPG.

Results from a representative animal (Expt. #3) of (A) 2f1−f2 DPOAEs under TM intact and perforated conditions. DPOAEs were induced by 2 equilevel (L1=L2) f1 and f2 primary tones at 90 dB SPL with an f2/f1 ratio of 1.25; Variations of (B) DPOAEs and (C) MEPG under TM perforation conditions compared to the intact TM condition in the same animal. Averaged results across animals of variations of (D) DPOAEs and (E) MEPG under TM perforation conditions compared to the intact TM condition. Gray lines represent the normal intact TM condition. Solid blue, green, and red lines represent <3%, ~10%, and ~25% removal of the pars tensa, respectively. Dashed blue, green, and red lines indicate 50%, 75%, and 100% removal of the pars tensa, respectively. Shaded areas in D & E represent mean ± 1 standard deviation. DPOAEs and MEPG could be measured with TM perforations up to 50% and 100%, respectively. Missing data points were in the noise floor and were removed for clarification.
