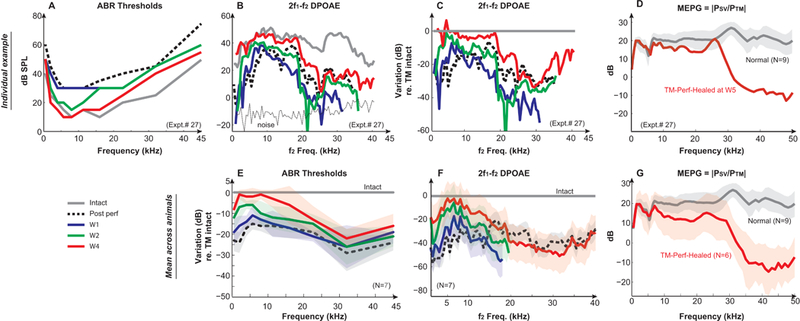
Figure 4. Hearing recoveries during the 50% post-perforation spontaneous healing process.

An individual example of (A) ABR thresholds, (B) 2f1−f2 DP-grams, and (C) the DPOAE variation compared to the TM intact condition over the recovery time period of 4 weeks, as well as the direct measures of (D) MEPG after 4-week recovery (from Expt. #27). Averaged variations of (E) ABR thresholds and (F) DPOAEs compared to that of the TM intact conditions across animals (N=7) at key time points, and (G) the averaged MEPG from spontaneously-healed animals measured at 5-week post-perforation conditions (N=6). MEPG under normal conditions (N=9) was plotted as a comparison. DPOAEs were evoked by two-tones of L1=L2=75 dB SPL with f2/f1=1.25. Solid gray lines represent the normal/intact condition. Dotted black lines represent the 50% post-perforation condition. Solid blue, green, and red lines represent 1-week, 2-week, and 4-week post perforation, respectively. Results of 3-week were similar to that of 4-week, and thus not shown. Missing data points were in the noise floor and were removed for clarification.
