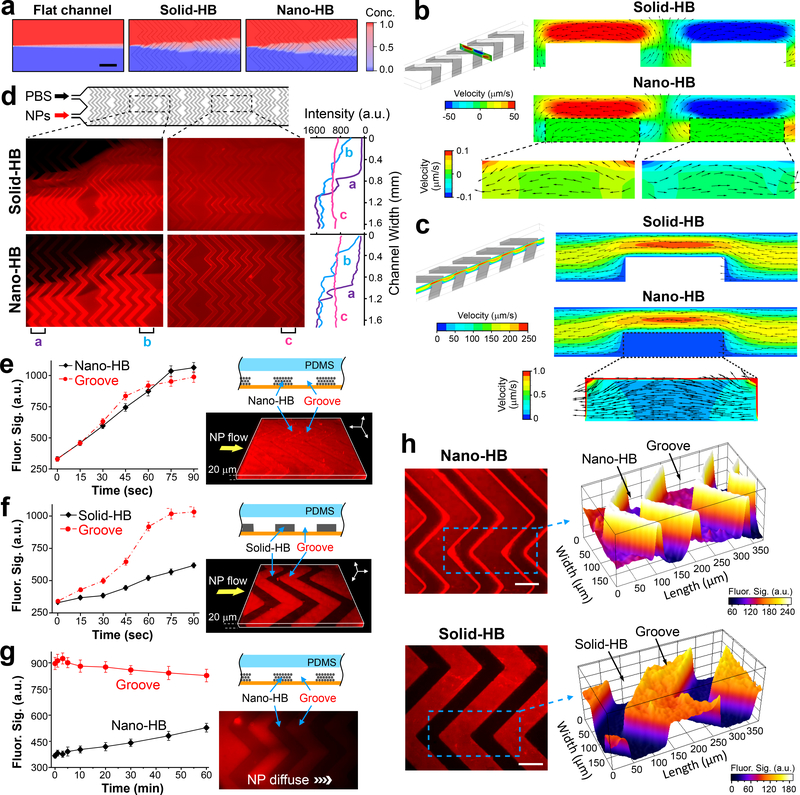
Fig. 2. Fluidic characterization of nano-HB chips.
(a) Simulation of mixing two streams of 50-nm nanoparticles (NPs) and water co-flowing at 1 μL/min in a flat-channel, solid-HB, or nano-HB device, respectively. Zoom-in view over the first two HB units was shown. Scale bar, 400 μm. (b, c) Simulation results showing the transverse flow profiles across the channel width (b) and the streamwise flow profiles along the channel length (c), respectively. Insets highlight the flow patterns inside the nanoporous domains. Color contours indicate the velocity magnitude, while vectors represent the flow direction. The flow rate was 0.5 μL/min. (d) Fluorescence images (left) and transverse intensity plots (right) of mixing two flows of 46-nm fluorescent NPs and PBS injected at 0.25 μL/min in parallel. The intensity plots were measured along the channel width at three positions on the images as indicated. (e, f) Time-lapse plots of fluorescence intensity measured in the HB structures and the open grooves when a solution of 46 nm fluorescent NPs was pumped through a nano- or solid-HB chip at 0.5 μL/min, respectively. 3D confocal fluorescence microscopy images (left) were acquired when the channels were filled with the NP solution. (g) Time-lapse monitoring of diffusion of 46-nm NPs from the grooves into nano-HB structures. Flow pumping was stopped when the NP solution entered the observation region. The fluorescence image (left) was acquired at t = 60 min. (h) Representative 2D confocal microscopic images of the nano-HB (top) and solid-HB structures (bottom), respectively, with the NP solution flowing through the channels. The images were acquired at approximately 15 μm below the HB surface. Partial surface plots of the images (right) were displayed for the areas indicated by the dashed rectangles. Scale bar, 100 μm. In (e-h), nano-HB chips were assembled with 960 nm silica colloids. a.u., arbitrary unit. Error bars, one standard deviation (S.D., n = 3).

