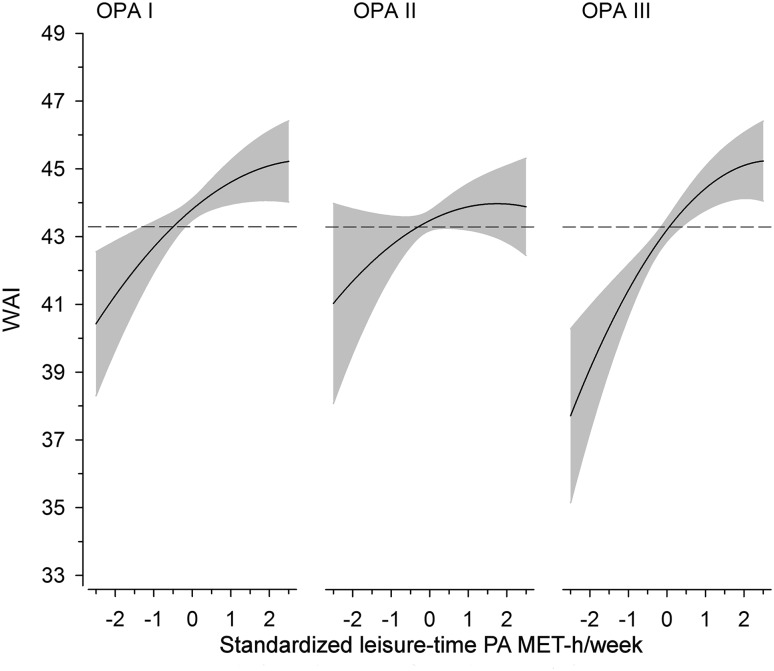
Fig. 2.
Relationship between standardized leisure-time physical activity (MET-h/week) and work ability index (WAI) in different occupational physical activity (OPA) tertiles. The curves were derived from a three-knot restricted cubic splines regression model. The model was adjusted for age, alcohol consumption, working class status, BMI, and employment years. The gray areas represent 95% confidence intervals. The dashed line indicates the mean value of all participants in WAI

