
Fig. 3.
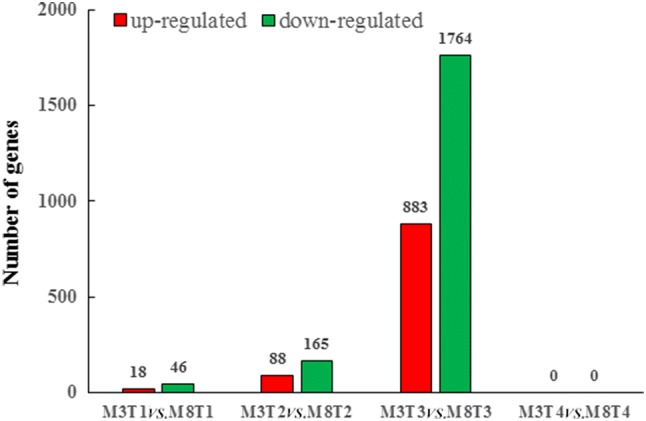
Differentially expressed genes among different groups in ‘M3’ and ‘M8’ at four seed developmental stages. The number of upregulated (red) and downregulated (green) DEGs in ‘M3’ relative to M8’ are shown at different seed developmental stages
Official websites use .gov
A
.gov website belongs to an official
government organization in the United States.
Secure .gov websites use HTTPS
A lock (
) or https:// means you've safely
connected to the .gov website. Share sensitive
information only on official, secure websites.
Differentially expressed genes among different groups in ‘M3’ and ‘M8’ at four seed developmental stages. The number of upregulated (red) and downregulated (green) DEGs in ‘M3’ relative to M8’ are shown at different seed developmental stages