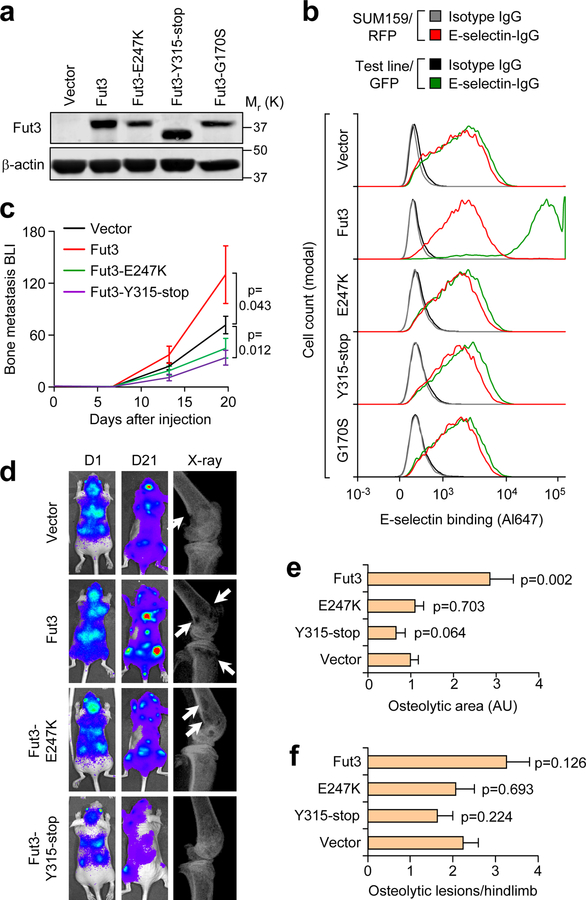
Figure 3. In vitro and in vivo characterization of Fut3 catalytic mutants.
(a) Western blot detection of three Fut3 catalytic mutants compared to wild-type Fut3 ectopically expressed in SUM159-M1a cells. (b) Comparative flow cytometry analysis of E-selectin binding to M1a cells expressing each Fut3 mutant using SUM159-RFP as an internal control. Data representative of 3 independent experiments (a,b). (c) BLI quantification of bone metastasis burden following intracardiac injection of M1a cells stably expressing each Fut3 mutant compared to vector and wild-type Fut3. n = 8 (Fut3 and Y315-stop) and 9 (E247K and Vector) mice/group. Mann-Whitney U test, two-sided. (d) Representative BLI and X-ray images from (c). (e,f) Quantification of osteloytic area (e) and the number of osteolytic lesions (f) in the hind limbs of Nu/Nu mice receiving an intracardiac injection of M1a cells expressing each Fut3 mutant. n = 16 (Fut3 and Y315-stop) and 18 (E247K and Vector) hindlimbs/group. Mann-Whitney U test, two-sided. Experiment performed once (c–f). Data represent mean ± SEM. Unprocessed original scans of the blots in a are shown Supplementary Fig. 9.

