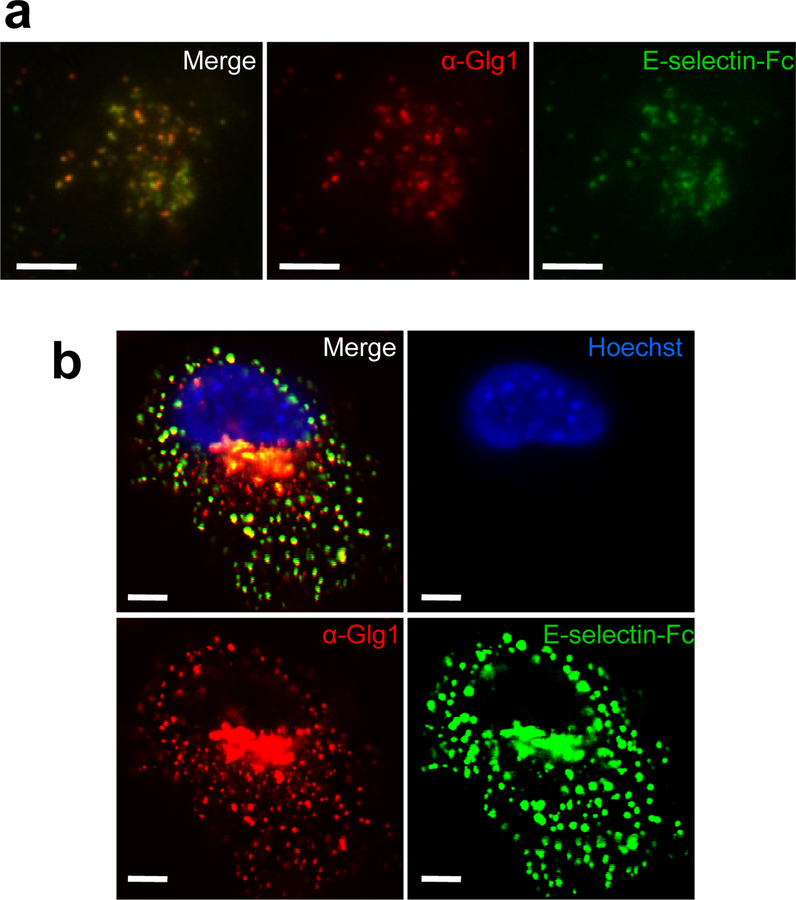
Figure 5. E-selectin ligands co-localize with Glg1 at the cell surface.
(a) Total internal reflectance fluorescence (TIRF) microscopy at the critical angle using a spinning disc was performed on SUM159-M1a cells probed with recombinant E-selectin-Fc (green) and anti-Glg1 (red). Scale bar represents 5 μm. (b) Confocal Z-slice of M1a cells probed with E-selectin-Fc (green), anti-Glg1 (red) and Hoechst (blue). Scale bar represents 5 μm. Data representative of 3 independent experiments (a, b).

