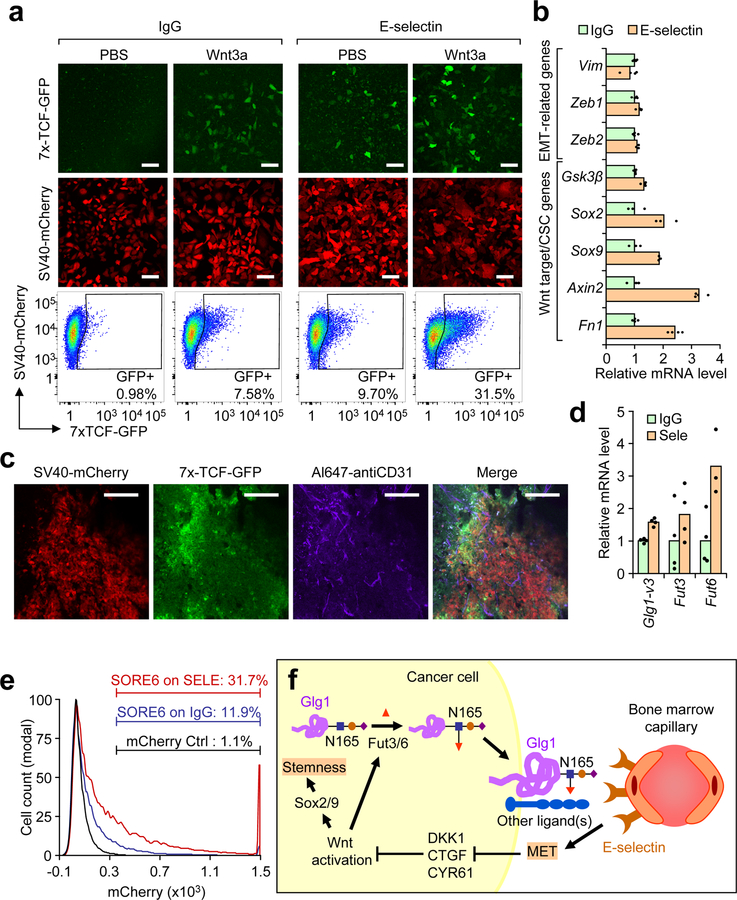
Figure 8. E-selectin-induced MET activates Wnt signaling.
(a) BM2 cells stably expressing the 7x TCF-GFP reporter and SV40-mCherry as internal control (BM2-TGC) were plated on either E-selectin or IgG coated (10 μg/mL) plates with or without recombinant Wnt3a (100 ng/mL). Fluorescence was assessed by confocal microscopy after 48 h and quantified by flow cytometry. Scale bars represent 100 μm. Data representative of >5 independent experiments. (b) qPCR analysis of EMT- or Wnt-associated genes from the BM2 cells plated on E-selectin or IgG (10 μg/mL) for 48 h. n= 3 technical replicates. (c) Ex vivo confocal images of bone metastasis in Nu/Nu mice injected with BM2-TGC. Live animal labeling with anti-CD31 was conducted to visualize vasculature. Scale bar represents 100 μm. Data representative of 4 biological replicates. (d) qPCR of Glg1-variant 3, Fut3 and Fut6 levels in BM2 cells seeded on either IgG or E-selectin (10 μg/mL) for 48 h. n = 4 technical replicates. (e) BM2 cells stably-expressing the SORE6-mCherry stemness reporter or control mCherry reporter were plated on E-selectin or control IgG (10 μg/mL) for 48 h. mCherry fluorescence was assessed by flow cytometry after 48 h. Data representative of 3 independent biological replicates. (f) Proposed model of E-selectin function during bone metastasis. Data represent mean ± SEM.

