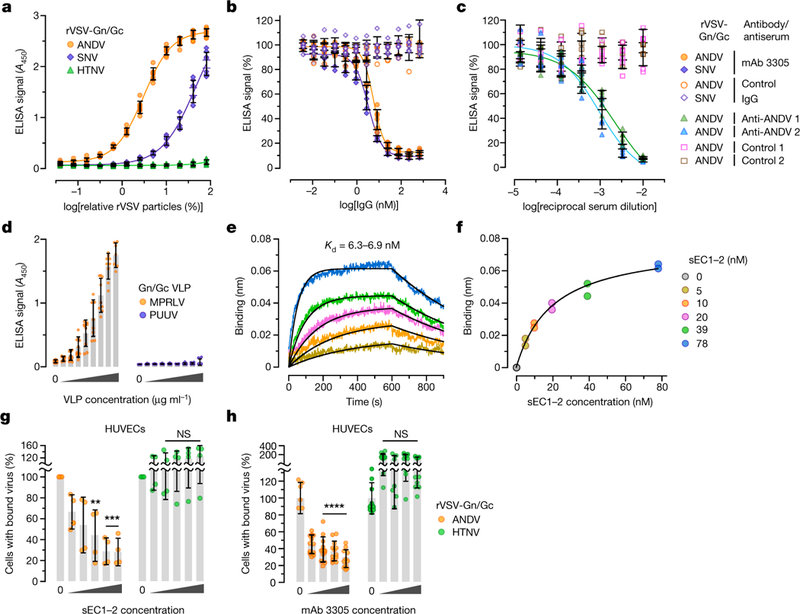
Fig. 3 |. PCDH1 mediates ANDV and SNV attachment to cells by binding directly to the viral glycoproteins.

a, Biotinylated rVSVs were added to sEC1–2-coated plates and rVSV capture was measured by ELISA. Averages ± s.d.: four experiments, n = 8. b, The capacity of PCDH1-specific mAb 3305 to block rVSV-Gn/Gc capture by sEC1–2 was measured by ELISA as in a. Immobilized sEC1–2 was incubated with a control IgG or with mAb 3305 before addition of biotinylated rVSVs. Averages ± s.d.: three experiments, n = 6. c, The capacity of Gn/Gc-reactive convalescent sera from two Chilean survivors of HPS to block binding between sEC1–2 and rVSV-Gn/Gc was measured by ELISA as in a. Biotinylated rVSV-ANDV Gn/Gc was incubated with serial dilutions of antisera and then added to sEC1–2-coated plates. Averages ± s.d.: three experiments, n = 6. d,The capacity of sEC1–2 to capture purified, Strep-tagged MPRLV or PUUV VLPs (0–170 μml–1) was measured by ELISA. Averages ± s.d.: three experiments, n = 7 for PUUV, n = 7 or 9 for MPRLV. e, Sensorgrams of sEC1–2 binding to MPRLV VLPs by biolayer interferometry. Experimental curves (coloured traces) were fit using a 1/1 binding model (black traces) to derive equilibrium dissociation constant (Kd) values. f, Response curve for steady-state analysis. Coloured dots correspond to the coloured curves in e. Results from two independent experiments are shown in e and f. g, Capacity of sEC1–2 to block viral attachment to cells. rVSVs bearing ANDV or HTNV Gn/Gc and labelled with functional-component spacer diacyl lipid (FSL)–fluorescein were preincubated with sEC1–2 (0–1.6 μM), and then exposed to HUVECs at 4 °C for 1 hour. Cells with bound viral particles were enumerated by flow cytometry. Averages ± s.d.: four experiments, n = 4. Untreated versus sEC1–2-treated, two-way ANOVA with Dunnett’s test; NS, P > 0.05; **P < 0.01; ***P < 0.001. h, Capacity of mAb 3305 to block viral attachment to cells. HUVECs were preincubated with mAb 3305 (0–68 nM) at 4 °C, and then exposed to DiD lipophilic-dye-labelled rVSVs bearing ANDV or HTNV Gn/Gc at 4 °C. We obtained 6–12 images per coverslip; virus-bound cells were analysed with Volocity software. Averages ± s.d.: three experiments, n = 12. Untreated versus antibody-treated, two-way ANOVA with Dunnett’s test; NS, P > 0.05; ****P < 0.0001.
